Visualizing and interpreting Cohen’s d effect sizes
Want to share your content on R-bloggers? click here if you have a blog, or here if you don't.
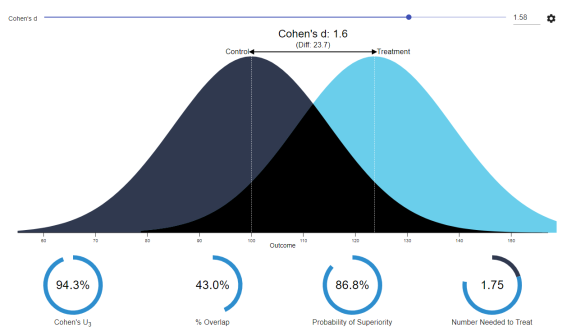
Cohen’s d (wiki) is a statistic used to indicate the standardised difference between two means. Resarchers often use it to compare the averages between groups, for instance to determine that there are higher outcomes values in a experimental group than in a control group.
Researchers often use general guidelines to determine the size of an effect. Looking at Cohen’s d, psychologists often consider effects to be small when Cohen’s d is between 0.2 or 0.3, medium effects (whatever that may mean) are assumed for values around 0.5, and values of Cohen’s d larger than 0.8 would depict large effects (e.g., University of Bath).

Kristoffer Magnusson hosts this Cohen’s d effect size comparison tool on his website the R Psychologist, but recently updated the visualization and its interactivity. And the tool looks better than ever:

Moreover, Kristoffer adds some nice explanatons of the numbers and their interpretation in real life situations:

If you find the tool useful, please consider buying Kristoffer a coffee or buying one of his beautiful posters, like the one above, or below:

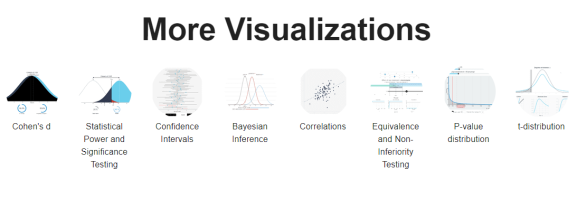
By the way, Kristoffer hosts many other interesting visualization tools (most made with JavaScript’s D3 library) on statistics and statistical phenomena on his website, have a look!

R-bloggers.com offers daily e-mail updates about R news and tutorials about learning R and many other topics. Click here if you're looking to post or find an R/data-science job.
Want to share your content on R-bloggers? click here if you have a blog, or here if you don't.
