Want to share your content on R-bloggers? click here if you have a blog, or here if you don't.
All you need to do with PCA is in Factoshiny!
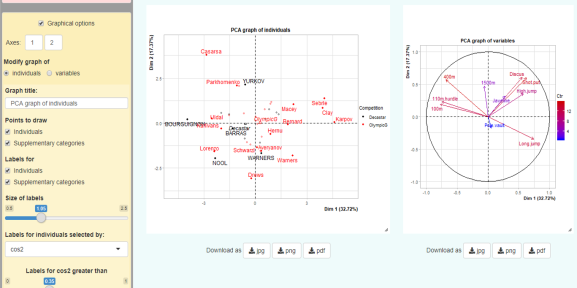
PCA – Principal Component Analysis – is a well known method for exploring and visualizing data. The function Factoshiny of the package Factoshiny allows you to perform PCA in a really easy way. You can include extras information such as categorical variables, manage missing data, draw and improve the graphs interactively, have several numeric indicators as outputs, perform clustering on the PCA results, and even have an automatic interpretation of the results. Finally, the function returns the lines of code to parameterize the analysis and redo the graphs, which makes the analysis reproducible.
See this video and the audio transcription of this video:
The lines of code to do a PCA:
install.packages(Factoshiny)
library(Factoshiny)
data(decathlon)
result <- Factoshiny(decathlon)
Theorectical and practical informations on PCA are available in these 3 course videos:
Here are the slides and the audio transcription of the course.
Here is the material used in the videos:
- Wines data: the data set – Rmarkdown– the script with the outputs
- Decathlon data: the data set– Rmarkdown – the script with the outputs
And here is a video that gives more information on the management of missing data.
Enjoy to make beautiful visualizations of your data!
R-bloggers.com offers daily e-mail updates about R news and tutorials about learning R and many other topics. Click here if you're looking to post or find an R/data-science job.
Want to share your content on R-bloggers? click here if you have a blog, or here if you don't.

