Extracting Sydney transport data from Twitter
Want to share your content on R-bloggers? click here if you have a blog, or here if you don't.
The @sydstats Twitter account uses this code base, and data from the Transport for NSW Open Data API to publish insights into delays on the Sydney Trains network.
Each tweet takes one of two forms and is consistently formatted, making it easy to parse and extract information. Here are a couple of examples with the interesting parts highlighted in bold:
Between 16:00 and 18:30 today, 26% of trips experienced delays. #sydneytrains
The worst delay was 16 minutes, on the 18:16 City to Berowra via Gordon service. #sydneytrains

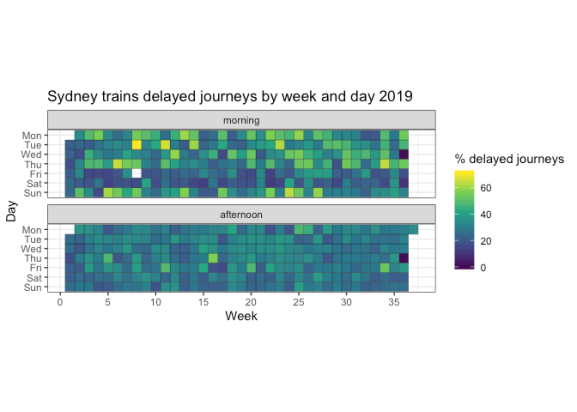
I’ve created a Github repository with code and a report showing some ways in which this data can be explored.
The take-home message: expect delays somewhere most days but in particular on Monday mornings, when students return to school after the holidays, and if you’re travelling in the far south-west or north-west of the network.
R-bloggers.com offers daily e-mail updates about R news and tutorials about learning R and many other topics. Click here if you're looking to post or find an R/data-science job.
Want to share your content on R-bloggers? click here if you have a blog, or here if you don't.
