This is not normal(ised)
Want to share your content on R-bloggers? click here if you have a blog, or here if you don't.
“Sydney stations where commuters fall through gaps, get stuck in lifts” blares the headline. The story tells us that:
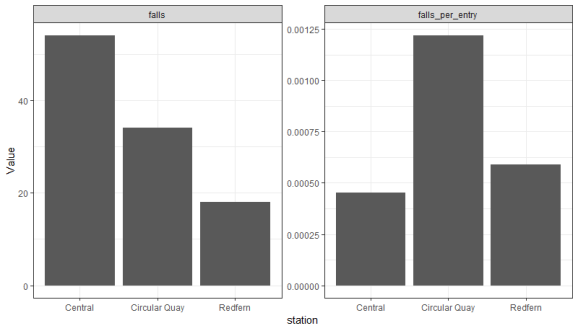
Central Station, the city’s busiest, topped the list last year with about 54 people falling through gaps
Wow! Wait a minute…
Central Station, the city’s busiest
Some poking around in the NSW Transport Open Data portal reveals how many people enter every Sydney train station on a “typical” day in 2016, 2017 and 2018. We could manipulate those numbers in various ways to estimate total, unique passengers for FY 2017-18 but I’m going to argue that the value as-is serves as a proxy variable for “station busyness”.
Grabbing the numbers for 2017:
library(tidyverse)

tibble(station = c("Central", "Circular Quay", "Redfern"),
       falls   = c(54, 34, 18),
       entries = c(118960, 27870, 30570)) %>%
  mutate(falls_per_entry = falls/entries) %>%
  select(-entries) %>%
  gather(Variable, Value, -station) %>%
  ggplot(aes(station, Value)) +
    geom_col() +
    facet_wrap(~Variable,
               scales = "free_y")

Looks like Circular Quay has the bigger problem. Now we have a data story. More tourists? Maybe improve the signage.
Deep in the comment thread, amidst the “only themselves to blame” crowd, one person gets it:

R-bloggers.com offers daily e-mail updates about R news and tutorials about learning R and many other topics. Click here if you're looking to post or find an R/data-science job.
Want to share your content on R-bloggers? click here if you have a blog, or here if you don't.
