Number 6174 or Kaprekar constant in R
Want to share your content on R-bloggers? click here if you have a blog, or here if you don't.
Not always is the answer 42 as explained in Hitchhiker’s guide. Sometimes it is also 6174.

Kaprekar number is one of those gems, that makes Mathematics fun. Indian recreational mathematician D.R.Kaprekar, found number 6174 – also known as Kaprekar constant – that will return the subtraction result when following this rules:
- Take any four-digit number, with minimum of two different numbers (1122 or 5151 or 1001 or 4375 and so on.)
- Sort the taken number and sort it descending order and ascending order.
- Subtract the descending number from ascending number.
- Repeat step 2. and 3. until you get the result 6174
In practice, e.g.: number 5462, the steps would be:
6542 - 2456 = 4086
8640 -  468 = 8172
8721 - 1278 = 7443
7443 - 3447 = 3996
9963 - 3699 = 6264
6642 - 2466 = 4176
7641 - 1467 = 6174
or for number 6235:
6532 - 2356 = 4176
7641 - 1467 = 6174
Based on different number, the steps might vary.
Function for Kaprekar is:
kap <- function(num){
    #check the len of number
    if (nchar(num) == 4) {
        kaprekarConstant = 6174
        while (num != kaprekarConstant) {
          nums <- as.integer(str_extract_all(num, "[0-9]")[[1]])
          sortD <- as.integer(str_sort(nums, decreasing = TRUE))
          sortD <- as.integer(paste(sortD, collapse = ""))
          sortA <- as.integer(str_sort(nums, decreasing = FALSE))
          sortA <- as.integer(paste(sortA, collapse = ""))
          num = as.integer(sortD) - as.integer(sortA)
          r <- paste0('Pair is: ',as.integer(sortD), ' and ', as.integer(sortA), ' and result of subtraction is: ', as.integer(num))
          print(r)
         }
    } else {
      print("Number must be 4-digits")
    }
}
Function can be used as:
kap(5462)
and it will return all the intermediate steps until the function converges.
[1] "Pair is: 6542 and 2456 and result of subtraction is: 4086"
[1] "Pair is: 8640 and 468  and result of subtraction is: 8172"
[1] "Pair is: 8721 and 1278 and result of subtraction is: 7443"
[1] "Pair is: 7443 and 3447 and result of subtraction is: 3996"
[1] "Pair is: 9963 and 3699 and result of subtraction is: 6264"
[1] "Pair is: 6642 and 2466 and result of subtraction is: 4176"
[1] "Pair is: 7641 and 1467 and result of subtraction is: 6174"
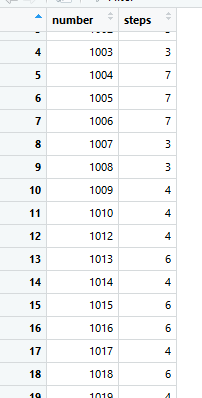
And to make the matter more interesting, let us find the distribution, based on all valid four-digit numbers, and append the number of steps needed to find the constant.
First, we will find the solutions for all four-digit numbers and store the solution in dataframe.
Create the empty dataframe:
#create empty dataframe for results
df_result <- data.frame(number =as.numeric(0), steps=as.numeric(0))
i = 1000
korak = 0
And then run the following loop:
# Generate the list of all 4-digit numbers
while (i <= 9999) {
   korak = 0
   num = i
   while ((korak <= 10) & (num != 6174)) {
      nums <- as.integer(str_extract_all(num, "[0-9]")[[1]])
      sortD <- as.integer(str_sort(nums, decreasing = TRUE))
      sortD <- as.integer(paste(sortD, collapse = ""))
      sortA <- as.integer(str_sort(nums, decreasing = FALSE))
      sortA <- as.integer(paste(sortA, collapse = ""))
      num = as.integer(sortD) - as.integer(sortA)

     korak = korak + 1
    if((num == 6174)){
     r <- paste0('Number is: ', as.integer(i), ' with steps: ', as.integer(korak))
     print(r)
     df_result <- rbind(df_result, data.frame(number=i, steps=korak))
   }
 }
i = i + 1
}
Fifteen seconds later, I got the dataframe with solutions for all valid (valid solutions are those that comply with step 1 and have converged within 10 steps) four-digit numbers.

Now we can add some distribution, to see how solutions are being presented with numbers. Summary of the solutions shows in average 4,6 iteration (mathematical subtractions) were needed in order to come to number 6174.

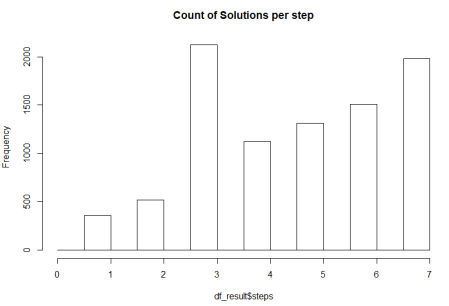
But adding the counts to steps, we get the most frequent solutions:
table(df_result$steps)
hist(df_result$steps)

With some additional visual, you can see the results as well:
library(ggplot2)
library(gridExtra)

#par(mfrow=c(1,2))
p1 <- ggplot(df_result, aes(x=number,y=steps)) +
geom_bar(stat='identity') +
scale_y_continuous(expand = c(0, 0), limits = c(0, 8))

p2 <- ggplot(df_result, aes(x=log10(number),y=steps)) +
geom_point(alpha = 1/50)

grid.arrange(p1, p2, ncol=2, nrow = 1)
And the graph:

A lot of numbers converges on third step, meaning that every 4th or 5th number. We would need to look into the steps of the solutions, what these numbers have in common. This will follow! So stay tuned.
Fun fact: For the time of writing this blog post, the number 6174 was not constant in R base. 
As always, code is available at Github.
Happy Rrrring 
R-bloggers.com offers daily e-mail updates about R news and tutorials about learning R and many other topics. Click here if you're looking to post or find an R/data-science job.
Want to share your content on R-bloggers? click here if you have a blog, or here if you don't.
