
openrouteservice – geodata!
Want to share your content on R-bloggers? click here if you have a blog, or here if you don't.
The openrouteservice provides a new method to get geodata into R. It has an API (or a set of them) and an R package has been written to communicate with said API(s) and is available from GitHub. I’ve just been playing around with the examples on this page, in the thought of using it for a project (more on that later if I get anywhere with it).
Anyways…onto the code…which is primarily a modification from the examples page I mentioned earlier (see that page for more examples).
devtools::install_github("GIScience/openrouteservice-r")
Load some libraries
library(openrouteservice)
library(leaflet)
Set the API key
ors_api_key("your-key-here")
Locations of interest and send the request to the API asking for the region that is accessible within a 15 minute drive of the coordinates.
coordinates <- list(c(8.55, 47.23424), c(8.34234, 47.23424), c(8.44, 47.4))

x <- ors_isochrones(coordinates,
 range = 60*15, # maximum time to travel (15 mins)
 interval = 60*15, # results in bands of 60*15 seconds (15 mins)
 intersections=FALSE) # no intersection of polygons
By changing the interval to, say, 60*5, three regions per coordinate are returned representing regions accessible within 5, 10 and 15 minutes drive. Changing the intersections argument would produce a separate polygon for any overlapping regions. The information of the intersected polygons is limited though, so it might be better to do the intersection with other tools afterwards.
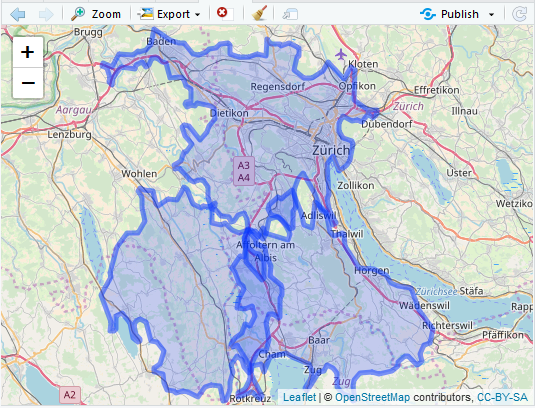
The results can be plotted with leaflet…
leaflet() %>%
 addTiles() %>%
 addGeoJSON(x) %>%
 fitBBox(x$bbox)
The blue regions are the three regions accessible within 15 minutes. A few overlapping regions are evident, each of which would be saved to a unique polygon had we set intersections to TRUE.
The results from the API come down in a GeoJSON format which is given a class of, in this case ors_isochrones, which isn’t recognized by so many formats so you might want to convert it to an sp object, giving access to all of the tools for those formats. That’s easy enough to do via the geojsonio package…
library(geojsonio)
class(x) <- "geo_list"
y <- geojson_sp(x)

library(sp)
plot(y)
You can also derive coordinates from (partial) addresses. Here is an example for a region of Bern in Switzerland, using the postcode.
coord <- ors_geocode("3012, Switzerland")
This resulted in 10 hits, the first of which was correct…the others were in different countries…
unlist(lapply(coord$features, function(x) x$properties$label))
[1] "3012, Bern, Switzerland"
 [2] "A1, Bern, Switzerland"
 [3] "Bremgartenstrasse, Bern, Switzerland"
 [4] "131 Bremgartenstrasse, Bern, Switzerland"
 [5] "Briefeinwurf Bern, Gymnasium Neufeld, Bern, Switzerland"
 [6] "119 Bremgartenstrasse, Bern, Switzerland"
 [7] "Gym Neufeld, Bern, Switzerland"
 [8] "131b Bremgartenstrasse, Bern, Switzerland"
 [9] "Gebäude Nord, Bern, Switzerland"
[10] "113 Bremgartenstrasse, Bern, Switzerland"
The opposite (coordinate to address) is also possible, again returning multiple hits…
address <- ors_geocode(location = c(7.425898, 46.961598))
unlist(lapply(address$features, function(x) x$properties$label))
[1] "3012, Bern, Switzerland"
[2] "A1, Bern, Switzerland"
[3] "Bremgartenstrasse, Bern, Switzerland"
[4] "131 Bremgartenstrasse, Bern, Switzerland"
[5] "Briefeinwurf Bern, Gymnasium Neufeld, Bern, Switzerland"
[6] "119 Bremgartenstrasse, Bern, Switzerland"
[7] "Gym Neufeld, Bern, Switzerland"
[8] "131b Bremgartenstrasse, Bern, Switzerland"
[9] "Gebäude Nord, Bern, Switzerland"
[10] "113 Bremgartenstrasse, Bern, Switzerland"
Other options are distances/times/directions between points and places of interest (POI) near a point or within a region.
Hope that helps someone! Enjoy!
R-bloggers.com offers daily e-mail updates about R news and tutorials about learning R and many other topics. Click here if you're looking to post or find an R/data-science job.
Want to share your content on R-bloggers? click here if you have a blog, or here if you don't.