The Year of Manchester City
Want to share your content on R-bloggers? click here if you have a blog, or here if you don't.
With 55 points from 19 games, Manchester City look absolutely unstoppable. No matter how you put it, the league leaders have been the best team so far this season. They sit 13 points above second-placed Manchester United and boast an impressive +48 goal difference.
While City have been superb, they have a recent history of losing momentum in the second half of the season. Articles from this to this have mentioned City’s momentum loss over the last few seasons.
I decided to analyze City’s recent history to see how the team have performed over the course of past seasons. Do City perform well at the beginning of the campaign and then drop off in the latter stages? To answer this question, I compiled data from Manchester City’s past seven seasons (including the current one) and visualized it.
The full, interactive visualization can be found on my page on Tableau’s website. But let’s talk about some specific graphs below:
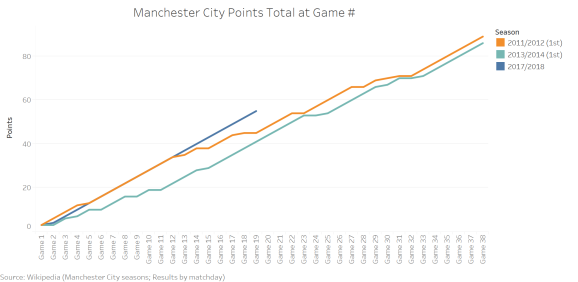
1. City’s 2017-2018 season is still going strong, even compared to their past two title-winning seasons (2011-2012 and 2013-2014)

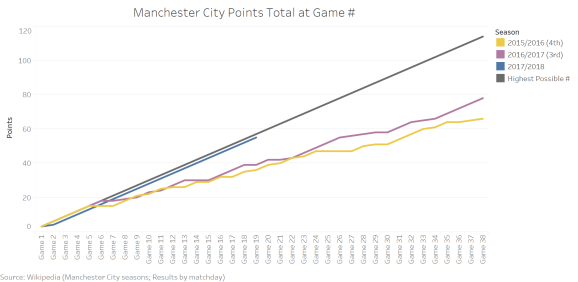
2. City Began Dropping Points Very Early in Past Two Seasons

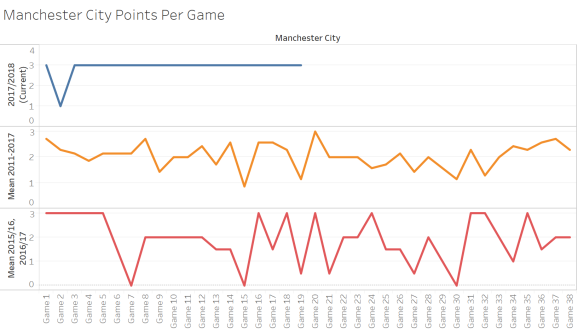
3. Manchester City’s Points Per Game is Unpredictable

Let me know what you think by commenting below. Feel free to view the interactive visualizations on Tableau as well (link #1 and link #2).
R-bloggers.com offers daily e-mail updates about R news and tutorials about learning R and many other topics. Click here if you're looking to post or find an R/data-science job.
Want to share your content on R-bloggers? click here if you have a blog, or here if you don't.
