August 2017

How to make best use of the byte compiler in R

August 7, 2017 | David Smith

Tomas Kalibera, the newest member of the R Core Team, has been working for the last several years with fellow Core Team member Luke Tierney implementing R's byte-code compiler and interpreter. Byte-compiling R code often improves its speed of execution, and usually happens without you having to take any explicit ... [Read more...]

Bayesian Simple Linear Regression with Gibbs Sampling in R

August 7, 2017 | Arman Oganisian

Many introductions to Bayesian analysis use relatively simple didactic examples (e.g. making inference about the probability of success given bernoulli data). While this makes for a good introduction to Bayesian principles, the extension of these principles to regression is not straight-forward. This post will sketch out how these principles ...
[Read more...]

US Immigration Enforcement – Part 1

August 7, 2017 | Scott Stoltzman

Trend of US Immigration Enforcement In the coming months I’ll be digging into the immigration enforcement data posted on data.world. I encourage anyone to take this data and either add to the project or to do something on their own. I will be bringing in external data sources ...
[Read more...]

Implementing Parallel Processing in R

August 7, 2017 | Perceptive Analytics

If something takes less time if done through parallel processing, why not do it and save time? Modern laptops and PCs today have multi core processors with sufficient amount of memory available and one can use it to generate outputs quickly. Parallelizing your codes has its own numerous advantages. Instead ... [Read more...]

Radial kernel Support Vector Classifier

August 7, 2017 | Anish Singh Walia

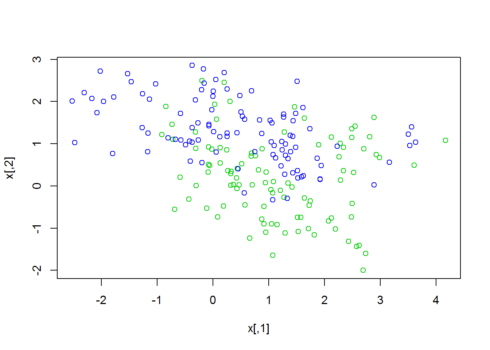
Support vector machines are a famous and a very strong classification technique which does not uses any sort of probabilistic model like any other classifier but simply generates hyperplanes or simply putting lines ,to separate and classify the data in some feature space into different regions. Support Vector Classifiers are ...
[Read more...]

Elegant correlation table using xtable R package

August 7, 2017 | Easy Guides

Correlation matrix analysis is an important method to find dependence between variables. Computing correlation matrix and drawing correlogram is explained here. The aim of this article is to show you how to get the lower and the upper triangular part of a correlation matrix. We will also use the xtable ... [Read more...]

R and Interactive Graphics

August 6, 2017 | R Views

Judging from the number of JSM talks that incorporated interactive visualizations of some sort or another, it appears that interactive graphics have captured the attention of a good many statisticians. I found this a little surprising. Statisticians, on the whole, are not easily impressed by “eye candy”, and I believe ...
[Read more...]

Geospatial Queries using Pymongo in R

August 6, 2017 | mlampros

Since I submitted the geojsonR package I was interested in running geospatial MongoDB queries using GeoJson data. I decided to use PyMongo (through the reticulate package) after opening two Github issues here and here. In my opinion, the PyMo... [Read more...]

More on “The Part-Time R-User”

August 6, 2017 | John Mount

I have some more thoughts on the topic: “the part-time R-user.” I am thinking a bit more about the diversity R users. It occurs to me simply dividing R users into two groups, beginning and advanced, neglects a very important group: the part-time R user. This leaves us teachers and ... [Read more...]

Playing with the US Population

August 6, 2017 | AdventuresInData

Here's an app that illustrates how fertility and death rates impact the US age structure diagram over time.  The app uses a simple population model to forecast the US age structure in 100 years, starting from 2010 census data and user-selected fertility and death rates.You can find and play with the ...
[Read more...]

Shiny (R) Web App Performance – Profiling

August 6, 2017 | Luke Singham

Introduced at the 2016 R conference, the profvis package offers a visual way of inspecting the call stack and highlights the most memory and computationally intensive parts of your code. Run Profvis # Load library library(profvis) # Run profiler on shiny app with optional arg to save output profvis({ runApp('Projects/ [Read more...]

Can we believe in the imputations?

August 5, 2017 | francoishusson

A popular approach to deal with missing values is to impute the data to get a complete dataset on which any statistical method can be applied. Many imputation methods are available and provide a completed dataset in any cases, whatever the number of individuals and/or variables, the percentage of ...
[Read more...]

Post-statistics: Lies, damned lies and data science patents

August 5, 2017 | msuzen

US Patent (Wikipedia) Statistics is so important field in our daily lives nowadays, the emerging field of 50 years old data science that is applied to almost every human activity now, or post-statistics, a kind of post-rock,  fusing operations research, data mining, software and performance engineering and of course multitude fields ...
[Read more...]
1 12 13 14 15 16 17

Never miss an update!
Subscribe to R-bloggers to receive
e-mails with the latest R posts.
(You will not see this message again.)

Click here to close (This popup will not appear again)