
Marketing Multi-Channel Attribution model with R (part 2: practical issues)
Want to share your content on R-bloggers? click here if you have a blog, or here if you don't.
This is the second post about the Marketing Multi-channel Attribution Model with Markov chains (here is the first one). Even though the concept of the first-order Markov chains is pretty simple, you can face other issues and challenges when implementing the approach in practice. In this article, we will review some of them. I tried to organize this article in a way that you can use it as a framework or can help you to create your own.
The main steps that we will review are the following:
- splitting paths depending on purchases counts
- replacing some channels/touch points
- a unique channel/touchpoint case
- consequent duplicated channels in the path and higher order Markov chains
- paths that haven’t led to a conversion
- customer journey duration
- attributing revenue and costs comparisons
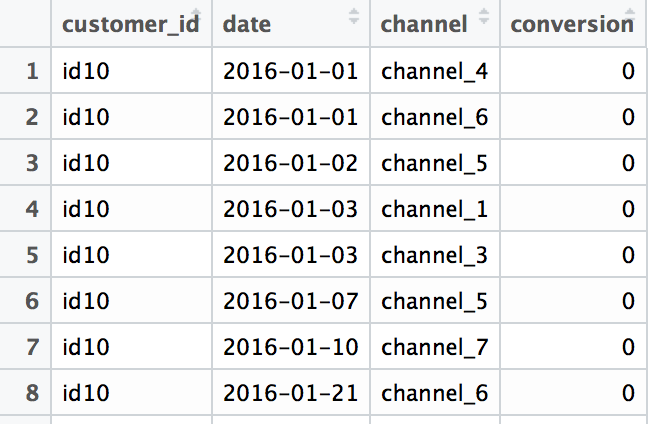
As usually, we start by simulating the data sample for experiments that includes customer ids, date stamp of contact with a marketing channel, marketing channel and conversion mark (0/1).
click to expand R code
library(tidyverse)
library(reshape2)
library(ChannelAttribution)
library(markovchain)
library(visNetwork)
library(expm)
library(stringr)


##### simulating the "real" data #####
set.seed(454)
df_raw <- data.frame(customer_id = paste0('id', sample(c(1:20000), replace = TRUE)),
 date = as.Date(rbeta(80000, 0.7, 10) * 100, origin = "2016-01-01"),
 channel = paste0('channel_', sample(c(0:7), 80000, replace = TRUE, prob = c(0.2, 0.12, 0.03, 0.07, 0.15, 0.25, 0.1, 0.08)))
 ) %>%
 group_by(customer_id) %>%
 mutate(conversion = sample(c(0, 1), n(), prob = c(0.975, 0.025), replace = TRUE)) %>%
 ungroup() %>%
 dmap_at(c(1, 3), as.character) %>%
 arrange(customer_id, date)

df_raw <- df_raw %>%
 mutate(channel = ifelse(channel == 'channel_2', NA, channel))
In addition, I’ve replaced channel_2 with NA values. The initial data sample looks like:
1. Splitting paths depending on purchases counts
##### splitting paths #####
df_paths <- df_raw %>%
 group_by(customer_id) %>%
 mutate(path_no = ifelse(is.na(lag(cumsum(conversion))), 0, lag(cumsum(conversion))) + 1) %>%
 ungroup()
df_paths_1 <- df_paths %>%
 filter(path_no == 1) %>%
 select(-path_no)
2. Replacing/removing touchpoints
##### replace some channels #####
df_path_1_clean <- df_paths_1 %>%
 # removing NAs
 filter(!is.na(channel)) %>%

 # adding order of channels in the path
 group_by(customer_id) %>%
 mutate(ord = c(1:n()),
 is_non_direct = ifelse(channel == 'channel_6', 0, 1),
 is_non_direct_cum = cumsum(is_non_direct)) %>%

 # removing Direct (channel_6) when it is the first in the path
 filter(is_non_direct_cum != 0) %>%

 # replacing Direct (channel_6) with the previous touch point
 mutate(channel = ifelse(channel == 'channel_6', channel[which(channel != 'channel_6')][is_non_direct_cum], channel)) %>%

 ungroup() %>%
 select(-ord, -is_non_direct, -is_non_direct_cum)
3. One- and multi-channel paths issue
- Split data for paths with one or more unique channels
- Calculate total conversions for one-channel paths and compute the Markov model for multi-channel paths
- Summarize results for each channel.
##### one- and multi-channel paths #####
df_path_1_clean <- df_path_1_clean %>%
 group_by(customer_id) %>%
 mutate(uniq_channel_tag = ifelse(length(unique(channel)) == 1, TRUE, FALSE)) %>%
 ungroup()

df_path_1_clean_uniq <- df_path_1_clean %>%
 filter(uniq_channel_tag == TRUE) %>%
 select(-uniq_channel_tag)

df_path_1_clean_multi <- df_path_1_clean %>%
 filter(uniq_channel_tag == FALSE) %>%
 select(-uniq_channel_tag)

### experiment ###
# attribution model for all paths
df_all_paths <- df_path_1_clean %>%
 group_by(customer_id) %>%
 summarise(path = paste(channel, collapse = ' > '),
 conversion = sum(conversion)) %>%
 ungroup() %>%
 filter(conversion == 1)

mod_attrib <- markov_model(df_all_paths,
 var_path = 'path',
 var_conv = 'conversion',
 out_more = TRUE)
mod_attrib$removal_effects
mod_attrib$result
d_all <- data.frame(mod_attrib$result)

# attribution model for splitted multi and unique channel paths
df_multi_paths <- df_path_1_clean_multi %>%
 group_by(customer_id) %>%
 summarise(path = paste(channel, collapse = ' > '),
 conversion = sum(conversion)) %>%
 ungroup() %>%
 filter(conversion == 1)

mod_attrib_alt <- markov_model(df_multi_paths,
 var_path = 'path',
 var_conv = 'conversion',
 out_more = TRUE)
mod_attrib_alt$removal_effects
mod_attrib_alt$result

# adding unique paths
df_uniq_paths <- df_path_1_clean_uniq %>%
 filter(conversion == 1) %>%
 group_by(channel) %>%
 summarise(conversions = sum(conversion)) %>%
 ungroup()

d_multi <- data.frame(mod_attrib_alt$result)

d_split <- full_join(d_multi, df_uniq_paths, by = c('channel_name' = 'channel')) %>%
 mutate(result = total_conversions + conversions)

sum(d_all$total_conversions)
sum(d_split$result)
4. Higher order of Markov chains and consequent duplicated channels in the path
##### Higher order of Markov chains and consequent duplicated channels in the path #####

# computing transition matrix - 'manual' way
df_multi_paths_m <- df_multi_paths %>%
 mutate(path = paste0('(start) > ', path, ' > (conversion)'))
m <- max(str_count(df_multi_paths_m$path, '>')) + 1 # maximum path length

df_multi_paths_cols <- colsplit(string = df_multi_paths_m$path, pattern = ' > ', names = c(1:m))
colnames(df_multi_paths_cols) <- paste0('ord_', c(1:m))
df_multi_paths_cols[df_multi_paths_cols == ''] <- NA

df_res <- vector('list', ncol(df_multi_paths_cols) - 1)

for (i in c(1:(ncol(df_multi_paths_cols) - 1))) {

 df_cache <- df_multi_paths_cols %>%
 select(num_range("ord_", c(i, i+1))) %>%
 na.omit() %>%
 group_by_(.dots = c(paste0("ord_", c(i, i+1)))) %>%
 summarise(n = n()) %>%
 ungroup()

 colnames(df_cache)[c(1, 2)] <- c('channel_from', 'channel_to')
 df_res[[i]] <- df_cache
}

df_res <- do.call('rbind', df_res)

df_res_tot <- df_res %>%
 group_by(channel_from, channel_to) %>%
 summarise(n = sum(n)) %>%
 ungroup() %>%
 group_by(channel_from) %>%
 mutate(tot_n = sum(n),
 perc = n / tot_n) %>%
 ungroup()

df_dummy <- data.frame(channel_from = c('(start)', '(conversion)', '(null)'),
 channel_to = c('(start)', '(conversion)', '(null)'),
 n = c(0, 0, 0),
 tot_n = c(0, 0, 0),
 perc = c(0, 1, 1))

df_res_tot <- rbind(df_res_tot, df_dummy)

# comparing transition matrices
trans_matrix_prob_m <- dcast(df_res_tot, channel_from ~ channel_to, value.var = 'perc', fun.aggregate = sum)
trans_matrix_prob <- data.frame(mod_attrib_alt$transition_matrix)
trans_matrix_prob <- dcast(trans_matrix_prob, channel_from ~ channel_to, value.var = 'transition_probability')

# computing attribution - 'manual' way
channels_list <- df_path_1_clean_multi %>%
 filter(conversion == 1) %>%
 distinct(channel)
channels_list <- c(channels_list$channel)

df_res_ini <- df_res_tot %>% select(channel_from, channel_to)
df_attrib <- vector('list', length(channels_list))

for (i in c(1:length(channels_list))) {

 channel <- channels_list[i]

 df_res1 <- df_res %>%
 mutate(channel_from = ifelse(channel_from == channel, NA, channel_from),
 channel_to = ifelse(channel_to == channel, '(null)', channel_to)) %>%
 na.omit()

 df_res_tot1 <- df_res1 %>%
 group_by(channel_from, channel_to) %>%
 summarise(n = sum(n)) %>%
 ungroup() %>%

 group_by(channel_from) %>%
 mutate(tot_n = sum(n),
 perc = n / tot_n) %>%
 ungroup()

 df_res_tot1 <- rbind(df_res_tot1, df_dummy) # adding (start), (conversion) and (null) states

 df_res_tot1 <- left_join(df_res_ini, df_res_tot1, by = c('channel_from', 'channel_to'))
 df_res_tot1[is.na(df_res_tot1)] <- 0

 df_trans1 <- dcast(df_res_tot1, channel_from ~ channel_to, value.var = 'perc', fun.aggregate = sum)

 trans_matrix_1 <- df_trans1
 rownames(trans_matrix_1) <- trans_matrix_1$channel_from
 trans_matrix_1 <- as.matrix(trans_matrix_1[, -1])

 inist_n1 <- dcast(df_res_tot1, channel_from ~ channel_to, value.var = 'n', fun.aggregate = sum)
 rownames(inist_n1) <- inist_n1$channel_from
 inist_n1 <- as.matrix(inist_n1[, -1])
 inist_n1[is.na(inist_n1)] <- 0
 inist_n1 <- inist_n1['(start)', ]

 res_num1 <- inist_n1 %*% (trans_matrix_1 %^% 100000)

 df_cache <- data.frame(channel_name = channel,
 conversions = as.numeric(res_num1[1, 1]))

 df_attrib[[i]] <- df_cache
}

df_attrib <- do.call('rbind', df_attrib)

# computing removal effect and results
tot_conv <- sum(df_multi_paths_m$conversion)

df_attrib <- df_attrib %>%
 mutate(tot_conversions = sum(df_multi_paths_m$conversion),
 impact = (tot_conversions - conversions) / tot_conversions,
 tot_impact = sum(impact),
 weighted_impact = impact / tot_impact,
 attrib_model_conversions = round(tot_conversions * weighted_impact)
 ) %>%
 select(channel_name, attrib_model_conversions)
5. Deal with paths that haven’t led to conversion
- At the least, you can model:
- customers’ flow through marketing channels,
- a projection of how many customers will touch the exact marketing channel after N touches or how many conversions you can obtain if you attract traffic (N visits) from this or that channel,
- what channels have a higher probability of user churn and thus know whether or not we should change the acquisition through them.
- an advanced approach that allows to use transition probabilities and other features like visits recency, frequency, durations, demographics, etc. in order to predict conversions with machine learning algorithms.
##### Generic Probabilistic Model #####
df_all_paths_compl <- df_path_1_clean %>%
 group_by(customer_id) %>%
 summarise(path = paste(channel, collapse = ' > '),
 conversion = sum(conversion)) %>%
 ungroup() %>%
 mutate(null_conversion = ifelse(conversion == 1, 0, 1))

mod_attrib_complete <- markov_model(
 df_all_paths_compl,
 var_path = 'path',
 var_conv = 'conversion',
 var_null = 'null_conversion',
 out_more = TRUE
)

trans_matrix_prob <- mod_attrib_complete$transition_matrix %>%
 dmap_at(c(1, 2), as.character)

##### viz #####
edges <-
 data.frame(
 from = trans_matrix_prob$channel_from,
 to = trans_matrix_prob$channel_to,
 label = round(trans_matrix_prob$transition_probability, 2),
 font.size = trans_matrix_prob$transition_probability * 100,
 width = trans_matrix_prob$transition_probability * 15,
 shadow = TRUE,
 arrows = "to",
 color = list(color = "#95cbee", highlight = "red")
 )

nodes <-
 data_frame(id = c(
 c(trans_matrix_prob$channel_from),
 c(trans_matrix_prob$channel_to)
 )) %>%
 distinct(id) %>%
 arrange(id) %>%
 mutate(
 label = id,
 color = ifelse(
 label %in% c('(start)', '(conversion)'),
 '#4ab04a',
 ifelse(label == '(null)', '#ce472e', '#ffd73e')
 ),
 shadow = TRUE,
 shape = "box"
 )

visNetwork(nodes,
 edges,
 height = "2000px",
 width = "100%",
 main = "Generic Probabilistic model's Transition Matrix") %>%
 visIgraphLayout(randomSeed = 123) %>%
 visNodes(size = 5) %>%
 visOptions(highlightNearest = TRUE)

##### modeling states and conversions #####
# transition matrix preprocessing
trans_matrix_complete <- mod_attrib_complete$transition_matrix
trans_matrix_complete <- rbind(trans_matrix_complete,
 df_dummy %>%
 mutate(transition_probability = perc) %>%
 select(channel_from, channel_to, transition_probability))
trans_matrix_complete$channel_to <- factor(trans_matrix_complete$channel_to, levels = c(levels(trans_matrix_complete$channel_from)))
trans_matrix_complete <- dcast(trans_matrix_complete, channel_from ~ channel_to, value.var = 'transition_probability')
trans_matrix_complete[is.na(trans_matrix_complete)] <- 0
rownames(trans_matrix_complete) <- trans_matrix_complete$channel_from
trans_matrix_complete <- as.matrix(trans_matrix_complete[, -1])

# creating empty matrix for modeling
model_mtrx <- matrix(data = 0,
 nrow = nrow(trans_matrix_complete), ncol = 1,
 dimnames = list(c(rownames(trans_matrix_complete)), '(start)'))
# adding modeling number of visits
model_mtrx['channel_5', ] <- 1000

c(model_mtrx) %*% (trans_matrix_complete %^% 5) # after 5 steps
c(model_mtrx) %*% (trans_matrix_complete %^% 100000) # after 100000 steps
6. Customer journey duration
##### Customer journey duration #####
# computing time lapses from the first contact to conversion/last contact
df_multi_paths_tl <- df_path_1_clean_multi %>%
 group_by(customer_id) %>%
 summarise(path = paste(channel, collapse = ' > '),
 first_touch_date = min(date),
 last_touch_date = max(date),
 tot_time_lapse = round(as.numeric(last_touch_date - first_touch_date)),
 conversion = sum(conversion)) %>%
 ungroup()

# distribution plot
ggplot(df_multi_paths_tl %>% filter(conversion == 1), aes(x = tot_time_lapse)) +
 theme_minimal() +
 geom_histogram(fill = '#4e79a7', binwidth = 1)

# cumulative distribution plot
ggplot(df_multi_paths_tl %>% filter(conversion == 1), aes(x = tot_time_lapse)) +
 theme_minimal() +
 stat_ecdf(geom = 'step', color = '#4e79a7', size = 2, alpha = 0.7) +
 geom_hline(yintercept = 0.95, color = '#e15759', size = 1.5) +
 geom_vline(xintercept = 23, color = '#e15759', size = 1.5, linetype = 2)


### for generic probabilistic model ###
df_multi_paths_tl_1 <- melt(df_multi_paths_tl[c(1:50), ] %>% select(customer_id, first_touch_date, last_touch_date, conversion),
 id.vars = c('customer_id', 'conversion'),
 value.name = 'touch_date') %>%
 arrange(customer_id)
rep_date <- as.Date('2016-01-10', format = '%Y-%m-%d')

ggplot(df_multi_paths_tl_1, aes(x = as.factor(customer_id), y = touch_date, color = factor(conversion), group = customer_id)) +
 theme_minimal() +
 coord_flip() +
 geom_point(size = 2) +
 geom_line(size = 0.5, color = 'darkgrey') +
 geom_hline(yintercept = as.numeric(rep_date), color = '#e15759', size = 2) +
 geom_rect(xmin = -Inf, xmax = Inf, ymin = as.numeric(rep_date), ymax = Inf, alpha = 0.01, color = 'white', fill = 'white') +
 theme(legend.position = 'bottom',
 panel.border = element_blank(),
 panel.grid.major = element_blank(),
 panel.grid.minor = element_blank(),
 axis.ticks.x = element_blank(),
 axis.ticks.y = element_blank()) +
 guides(colour = guide_legend(override.aes = list(size = 5)))

df_multi_paths_tl_2 <- df_path_1_clean_multi %>%
 group_by(customer_id) %>%
 mutate(prev_touch_date = lag(date)) %>%
 ungroup() %>%
 filter(conversion == 1) %>%
 mutate(prev_time_lapse = round(as.numeric(date - prev_touch_date)))

# distribution
ggplot(df_multi_paths_tl_2, aes(x = prev_time_lapse)) +
 theme_minimal() +
 geom_histogram(fill = '#4e79a7', binwidth = 1)

# cumulative distribution
ggplot(df_multi_paths_tl_2, aes(x = prev_time_lapse)) +
 theme_minimal() +
 stat_ecdf(geom = 'step', color = '#4e79a7', size = 2, alpha = 0.7) +
 geom_hline(yintercept = 0.95, color = '#e15759', size = 1.5) +
 geom_vline(xintercept = 12, color = '#e15759', size = 1.5, linetype = 2)


# extracting data for generic model
df_multi_paths_tl_3 <- df_path_1_clean_multi %>%
 group_by(customer_id) %>%
 mutate(prev_time_lapse = round(as.numeric(date - lag(date)))) %>%
 summarise(path = paste(channel, collapse = ' > '),
 tot_time_lapse = round(as.numeric(max(date) - min(date))),
 prev_touch_tl = prev_time_lapse[which(max(date) == date)],
 conversion = sum(conversion)) %>%
 ungroup() %>%
 mutate(is_fruitless = ifelse(conversion == 0 & tot_time_lapse > 20 & prev_touch_tl > 10, TRUE, FALSE)) %>%
 filter(conversion == 1 | is_fruitless == TRUE)
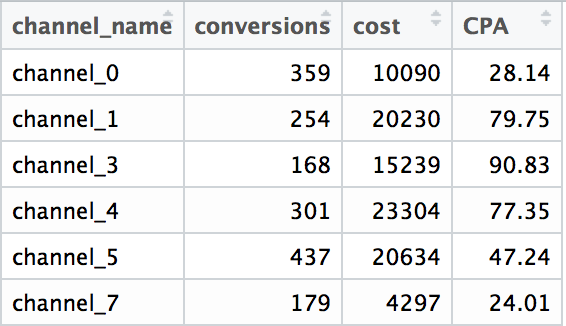
7. Attributing revenue and costs comparison
Conclusions
- the Markov model can be effectively used for LTV prediction
- we can include additional types of interactions into the model (for example, banner impressions, tv ads, calls to callcenter and so on) and evaluate their influence
- develop “likely to buy” predictive model using ML algorithms
The post Marketing Multi-Channel Attribution model with R (part 2: practical issues) appeared first on AnalyzeCore - data is beautiful, data is a story.
R-bloggers.com offers daily e-mail updates about R news and tutorials about learning R and many other topics. Click here if you're looking to post or find an R/data-science job.
Want to share your content on R-bloggers? click here if you have a blog, or here if you don't.