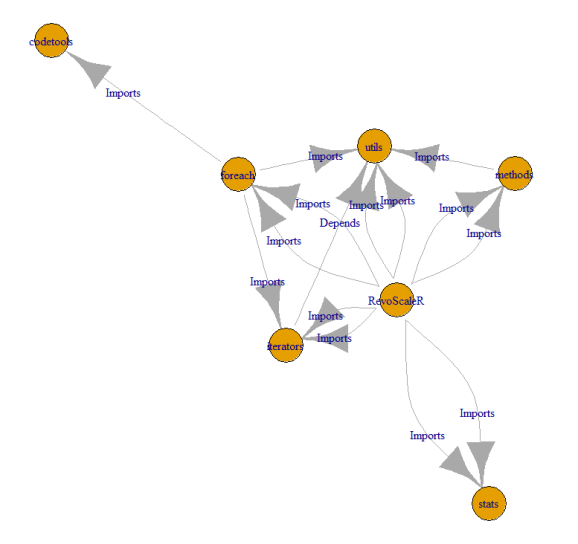
RevoScaleR package dependencies with graph visualization
Want to share your content on R-bloggers? click here if you have a blog, or here if you don't.
MRAN currently holds 7520 R Packages. We can see this with usage of following command (stipulating that you are using MRAN R version. ):
library(tools)
df_ap <- data.frame(available.packages())
head(df_ap)

With importing package tools, we get many useful functions to find additional information on packages.
Function package.dependencies() parses and check dependencies of a package in current environment. Function package_dependencies() (with underscore and not dot) will find all dependent and reverse dependent packages.
With following code I can extract the packages and their dependencies (this will perform a data normalization):
net <- data.frame(df_ap[,c(1,4)])
library(dplyr)
netN <- net %>%
        mutate(Depends = strsplit(as.character(Depends), ",")) %>%
        unnest(Depends)
netN
And the result is:
Source: local data frame [14,820 x 2]

   Package       Depends
    (fctr)         (chr)
1       A3 R (>= 2.15.0)
2       A3        xtable
3       A3       pbapply
4   abbyyR  R (>= 3.2.0)
5      abc   R (>= 2.10)
6      abc      abc.data
7      abc          nnet
8      abc      quantreg
9      abc          MASS
10     abc        locfit
..     ...           ...
Presented way needs to be further cleaned and prepared.
Once you have data normalized, we can use any of the network packages for visualizing the data. With use of igraph package, I created visual presentation of the RevoScaleR package; dependencies and imported packages.
With the code I filter out the RevoScaleR package and create visual:
library(igraph)
netN_g <- graph.data.frame(edges[edges$src %in% c('RevoScaleR', deptree), ])
plot(netN_g)

Happy Ring!
R-bloggers.com offers daily e-mail updates about R news and tutorials about learning R and many other topics. Click here if you're looking to post or find an R/data-science job.
Want to share your content on R-bloggers? click here if you have a blog, or here if you don't.
