

[This article was first published on RClimate, and kindly contributed to R-bloggers]. (You can report issue about the content on this page here)
Want to share your content on R-bloggers? click here if you have a blog, or here if you don't.
Want to share your content on R-bloggers? click here if you have a blog, or here if you don't.
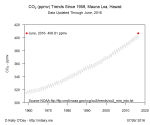
This blog focuses on how to use R to study climate data. I will be using readily available public climate data and R to understand global warming and climate trends. These charts show the types of that I will be making.


To leave a comment for the author, please follow the link and comment on their blog: RClimate.
R-bloggers.com offers daily e-mail updates about R news and tutorials about learning R and many other topics. Click here if you're looking to post or find an R/data-science job.
Want to share your content on R-bloggers? click here if you have a blog, or here if you don't.