Revisiting crimes against women in India
Want to share your content on R-bloggers? click here if you have a blog, or here if you don't.
Here I go again, raking the muck about crimes against women in India. My earlier post “A crime map of India in R: Crimes against women in India” garnered a lot of responses from readers. In fact one of the readers even volunteered to create the only choropleth map in that post. The data for this post is taken from http://data.gov.in. You can download the data from the link “Crimes against women in India”
I was so impressed by the choropleth map that I decided to do that for all crimes against women.(Wikipedia definition: A choropleth map is a thematic map in which areas are shaded or patterned in proportion to the measurement of the statistical variable being displayed on the map). Personally, I think pictures tell the story better. I am sure you will agree!
So here, I have it a Shiny app which will plot choropleth maps for a chosen crime in a given year.
You can try out my interactive Shiny app at Crimes against women in India
In the picture below are the details of ‘Rape” in the year 2015.

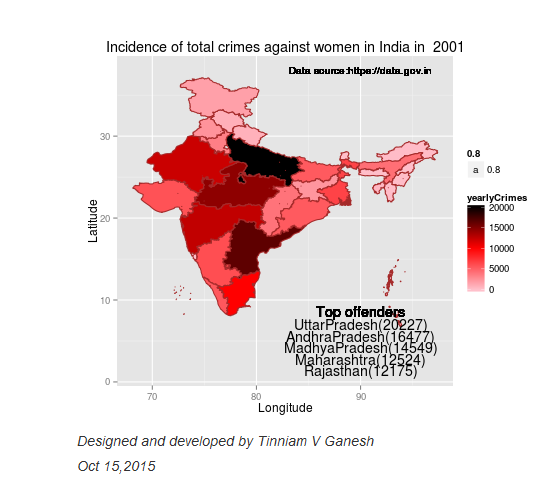
Interestingly the ‘Total Crime against women’ in 2001 shows the Top 5 as
1) Uttar Pradresh 2) Andhra Pradesh 3) Madhya Pradesh 4) Maharashtra 5) Rajasthan
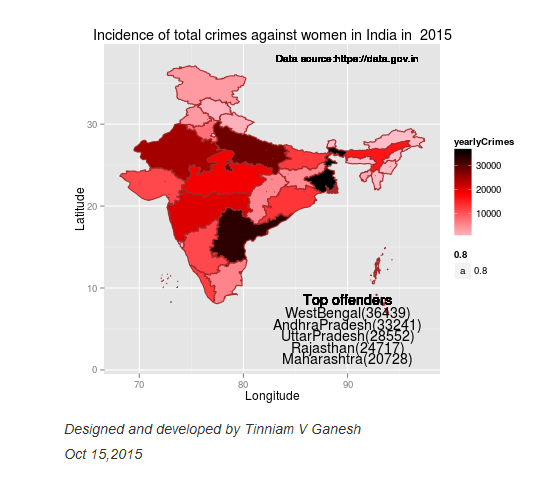
But in 2015 West Bengal tops the list, as the real heavy weight in crimes against women. The new pecking order in 2015 for ‘Total Crimes against Women’ is
1) West Bengal 2) Andhra Pradesh 3) Uttar Pradesh 4) Rajasthan 5) Maharashtra
Similarly for rapes, West Bengal is nowhere in the top 5 list in 2001. In 2015, it is in second only to the national rape leader Madhya Pradesh. Also in 2001 West Bengal is not in the top 5 for any of 6 crime heads. But in 2015, West Bengal is in the top 5 of 6 crime heads. The emergence of West Bengal as the leader in Crimes against Women is due to the steep increase in crime rate over the years.Clearly the law and order situation in West Bengal is heading south.
In Dowry Deaths, UP, Bihar, MP, West Bengal lead the pack, and in that order in 2015.
The usual suspects for most crime categories are West Bengal, UP, MP, AP & Maharashtra.
The state-wise crime charts plot the incidence of the crime (rape, dowry death, assault on women etc) over the years. Data for each state and for each crime was available from 2001-2013. The data for period 2014-2018 are projected using linear regression. The shaded portion in the plots indicate the 95% confidence level in the prediction (i.e in other words we can be 95% certain that the true mean of the crime rate in the projected years will lie within the shaded region)
Several interesting requests came from readers to my earlier post. Some of them were to to plot the crimes as function of population and per capita income of the State/Union Territory to see if the plots throw up new crime leaders. I have not got the relevant state-wise population distribution data yet. I intend to update this when I get my hands on this data.
I have included the crimes.csv which has been used to generate the visualization. However for the Shiny app I save this as .RData for better performance of the app.
You can clone/download the code for the Shiny app from GitHub at crimesAgainWomenIndia
Please checkout my Shiny app : Crimes against women
I also intend to add further interactivity to my visualizations in a future version. Watch this space. I’ll be back!
You may like
1. Natural Language Processing: What would Shakespeare say?
2. Introducing cricketr! : An R package to analyze performances of cricketers
3. A peek into literacy in India: Statistical Learning with R
4. Informed choices through Machine Learning : Analyzing Kohli, Tendulkar and Dravid
5. Re-working the Lucy-Richardson Algorithm in OpenCV
6. What’s up Watson? Using IBM Watson’s QAAPI with Bluemix, NodeExpress – Part 1
7. Bend it like Bluemix, MongoDB with autoscaling – Part 2
8. TWS-4: Gossip protocol: Epidemics and rumors to the rescue
9. Thinking Web Scale (TWS-3): Map-Reduce – Bring compute to data
10. Simulating an Edge Shape in Android
R-bloggers.com offers daily e-mail updates about R news and tutorials about learning R and many other topics. Click here if you're looking to post or find an R/data-science job.
Want to share your content on R-bloggers? click here if you have a blog, or here if you don't.


