Visualizing bdsns data using bdvis
Want to share your content on R-bloggers? click here if you have a blog, or here if you don't.
One of the tasks in my Google Summer of Code 2015 was to integrate new package bdsns with existing package bdvis to identify strengths and gaps in the data. This can be achieved with few simple steps.
Begin with opening both libraries
library(devtools)
install_github("vijaybarve/bdsns")
install_github("vijaybarve/bdvis")
library(bdsns)
library(bdvis)
Get data for few species of butterflies using bdsns package from Flickr and store in sqlite database. User needs to get own API key form Flickr website from here. A file containing few scientific names of butterfly species
bflytest.txt
scname
Graphium agetes
Graphium antiphates
Graphium aristeus
Colias nilagiriensis
Dercas verhuelli
Eurema andersoni
Gonepteryx rhamni
Hebomoia glaucippe
Euripus nyctelius
Hestinalis nama
Mimathyma ambica
Ariadne merione
Byblia ilithyia
Abisara echerius
Abisara neophron
Zemeros flegyas
Curetis thetis
Heliophorus epicles
Spalgis epeus
Hasora badra
Hasora chromus
Gangara lebadea
Gangara thyrsis
And then we are all set to run the command to download and store the data in sqlite database.
flickrtodatabase(myapikey,"bflytest.txt",
                  "scname","testdb")
Read in the sqlite database
dat=extract_flickrdb("testdb","t1.csv")
Set up the data for use in bdvis.Function format_bdvis will set the field names for scientific name, latitude, longitude and date in the bdvis format and also assigh grid cell ids. Function gettaxo will fetch and store higher taxonomy of the species.
dat=format_bdvis(dat)
dat=gettaxo(dat)
Now bdvis functions can be used for visualizations
mapgrid(dat)
tempolar(dat)
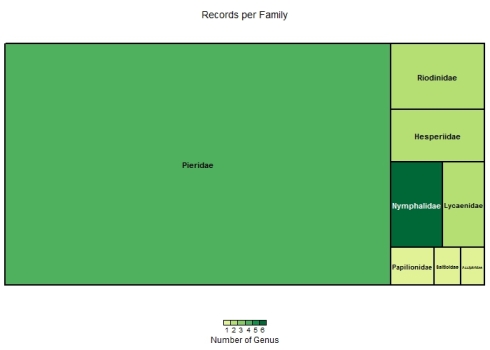
taxotree(dat)
chronohorogram(dat)
bdcalenderheat(dat)
Here is a sample of what this code will produce:


 Please note the results may not exactly match, since new photographs are being posted continuously on Flickr.
Read more about bdsns here
Barve, V. (2014). Discovering and developing primary biodiversity data from social networking sites: A novel approach. Ecological Informatics, 24, 194–199. doi:10.1016/j.ecoinf.2014.08.008
R-bloggers.com offers daily e-mail updates about R news and tutorials about learning R and many other topics. Click here if you're looking to post or find an R/data-science job.
Want to share your content on R-bloggers? click here if you have a blog, or here if you don't.


