Wrangling Complex Spreadsheet Column Headers
Want to share your content on R-bloggers? click here if you have a blog, or here if you don't.
[This isn’t an R post, per se, but I’m syndicating it via RBloggers because I’m interested – how do you work with hierarchical column indices in R? Do you try to reshape the data to something tidier on the way in? Can you autodetect elements to help with any reshaping?]
Not a little p****d off by the Conservative election pledge to extend the right-to-buy to housing association tenants (my response: so extend the right to private tenants too?) I thought I’d have a dig around to see what data might be available to see what I could learn about the housing situation on the Isle of Wight, using a method that could also be used in other constituencies. That is, what datasets are provided at a national level, broken down to local level. (To start with, I wanted to see what I could lean ex- of visiting the DCLG OpenDataCommuniteis site.
One source of data seems to be the Local authority housing statistics data returns for 2013 to 2014, a multi-sheet spreadsheet reporting at a local authority level on:
– Dwelling Stock
– Local Authority Housing Disposals
– Allocations
– Lettings, Nominations and Mobility Schemes
– Vacants
– Condition of Dwelling Stock
– Stock Management
– Local authority Rents and Rent Arrears
– Affordable Housing Supply
Something I’ve been exploring lately are “external spreadsheet data source” wrappers for the pandas Python library that wrap frequently released spreadsheets with a simple (?!) interface that lets you pull the data from the spreadsheet into a pandas dataframe.
For example, I got started on the LA housing stats sheet as follows – first a look at the sheets, then a routine to grab sheet names out of the Menu sheet:
import pandas as pd
dfx=pd.ExcelFile('Local_Authority_Housing_Statistics_dataset_2013-14.xlsx')
dfx.sheet_names
#...
#Menu sheet parse to identify sheets A-I
import re
sd=re.compile(r'Section (w) - (.*)$')
sheetDetails={}
for row in dfx.parse('Menu')[[1]].values:
    if str(row[0]).startswith('Section'):
        sheetDetails[sd.match(row[0]).group(1)]=sd.match(row[0]).group(2)
sheetDetails
#{u'A': u'Dwelling Stock',
# u'B': u'Local Authority Housing Disposals',
# u'C': u'Allocations',
# u'D': u'Lettings, Nominations and Mobility Schemes',
# u'E': u'Vacants',
# u'F': u'Condition of Dwelling Stock',
# u'G': u'Stock Management',
# u'H': u'Local authority Rents and Rent Arrears',
# u'I': u'Affordable Housing Supply'}
All the data sheets have similar columns on the left-hand side, which we can use as a crib to identify the simple, single row, coded header column.
def dfgrabber(dfx,sheet):
    #First pass - identify row for headers
    df=dfx.parse(sheet,header=None)
    df=df.dropna(how='all')
    row = df[df.apply(lambda x: (x == "DCLG code").any(), axis=1)].index.tolist()[0]#.values[0] # will be an array
    #Second pass - generate dataframe
    df=dfx.parse(sheet,header=row).dropna(how='all').dropna(how='all',axis=1)
    df=df[df['DCLG code'].notnull()].reset_index(drop=True)
    return df

#usage:
dfgrabber(dfx,'H')[:5]
That gives something like the following:
This is completely useable if we know what the column codes refer to. What is handy is that a single row is available for columns, although metadata that neatly describes the codes is not so tidily presented:
Trying to generate pandas hierarchical index from this data is a bit messy…
One approach I’ve explored is trying to create a lookup table from the coded column names back into the hierarchical column names.
For example, if we can detect the column multi-index rows, we can fill down on the first row (for multicolumn labels, the label is in the leftmost cell), then fill down to fill the index grid spanned cells with the value that spans them.
#row is autodetected and contains the row for the simple header
row=7
#Get the header columns - and drop blank rows
xx=dfx.parse('A',header=None)[1:row].dropna(how='all')
xx
#Fill down
xx.fillna(method='ffill', axis=0,inplace=True)
#Fill across
xx=xx.fillna(method='ffill', axis=1)
xx
#append the coded header row
xx=xx.append(dfx.parse('A',header=None)[row:row+1])
xx
#Now make use of pandas' ability to read in a multi-index CSV
xx.to_csv('multi_index.csv',header=False, index=False)
mxx=pd.read_csv('multi_index.csv',header=[0,1,2])
mxx
Note that the pandas column multi-index can span several columns, but not “vertical” levels.
Get rid of the columns that don’t feature in the multi-index:
for c in mxx.columns.get_level_values(0).tolist():
    if c.startswith('Unnamed'):
        mxx = mxx.drop(c, level=0, axis=1)
mxx
Now start to work on the lookup…
#Get a dict from the multi-index
mxx.to_dict(orient='record')
We can then use this as a basis for generating a lookup table for the column codes.
keyx={}
for r in dd:
    keyx[dd[r][0].split(' ')[0]]=r
keyx
We could also generate more elaborate dicts to provide ways of identifying particular codes.
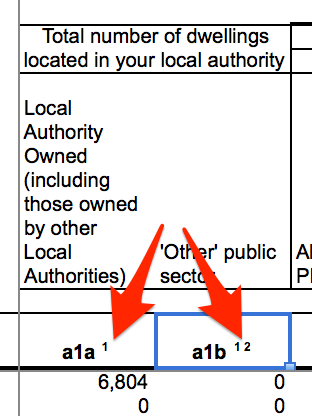
Note that the key building required a little bit of tidying required arising from footnote numbers that appear in some of the coded column headings:
This tidying should be also be applied to the code column generation step above…
I’m thinking there really should be an easier way?
R-bloggers.com offers daily e-mail updates about R news and tutorials about learning R and many other topics. Click here if you're looking to post or find an R/data-science job.
Want to share your content on R-bloggers? click here if you have a blog, or here if you don't.


