Contingency Tables with gmodels in R
Want to share your content on R-bloggers? click here if you have a blog, or here if you don't.
 Contingency tables provide a way to display the frequencies and relative frequencies of observations, which are classified according to two categorical variables. The elements of one category are displayed across the columns; the elements of the other category are displayed over the rows.
For many semesters now, I’ve asked my students to prepare contingency tables that include row percentages and column percentages. Oh, and also the marginal distributions… you know, the totals on the right margin and the bottom margin. There’s an easy way to do this using Minitab, but I’m not a fan of proprietary software… I prefer open source whenever possible, and I wasn’t aware of a way to do this in R. As a result, I let them build their contingency tables by hand, and type them up in Microsoft Word. (Yeah, not efficient at all.)
Then I found gmodels. After installing gmodels and using:
library(gmodels)
to bring the package into active memory, I was able to create a contingency table SO easily that I can’t bear to think about all the hours I spent doing this sort of thing manually. First, I loaded some data describing the colors and defects associated with over 1200 M&M candies that my students observed. This data set has four variables: student (who collected the data), id (the number of the M&M that the student observed, in order of when they encountered that particular M&M), color (whether the candy was Blue, Red, BRown, Green, Orange, or Yellow), and whether there were defects observed (Letter incomplete or missing, Chipped or Cracked, Multiple defects, or No defects):
> mnms <- read.csv("mnm-clean.csv",header=T)
> head(mnms)
 student id color defect
1 wilburld 1 B L
2 wilburld 2 B N
3 wilburld 3 B N
4 wilburld 4 B N
5 wilburld 5 B N
6 wilburld 6 B C
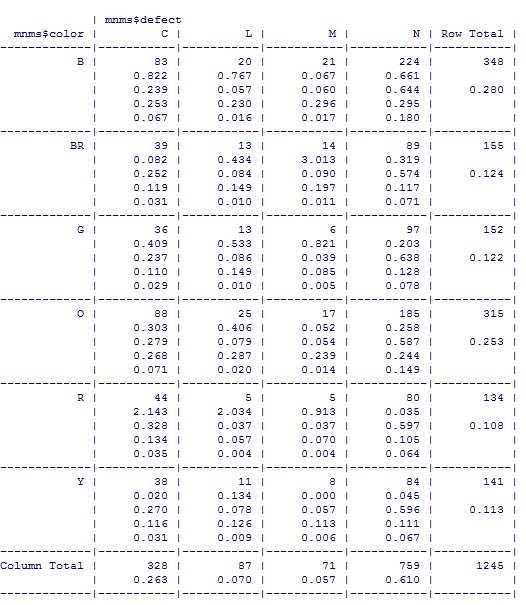
Then, I constructed a really fancy contingency table IN JUST ONE LINE!!! This was very exciting.
> CrossTable(mnms$color, mnms$defect, prop.t=TRUE, prop.r=TRUE, prop.c=TRUE)
You can control whether row percentages (prop.r), column percentages (prop.c), or table percentages (prop.t) show up by making them TRUE in your call to CrossTable. Here’s what it looked like:
You can also do a full Chi-square test of independence WHILE you’re displaying your contingency table… all you need to do is specify the chisq=TRUE argument to CrossTable. Here’s what I got for that:
Statistics for All Table Factors
Pearson's Chi-squared test
------------------------------------------------------------
Chi^2 = 14.47214 d.f. = 15 p = 0.4900641
So, with a p-value that high, the color of M&M and whether it has a defect are INDEPENDENT. That makes sense. If they were not independent, then maybe there’s a problem with the production process.
I also found this fantastic paper that describes how one researcher is exploring alternative (and hopefully better!) ways to visualize categorical data. In addition to being an interesting read, it demonstrates alternatives like the mosaic.
Postscript: I just put a copy of the M&M data on a GitHub repository. I think I’ve started a new habit… this is fantastic. I can actually pull my data directly into R from GitHub. It’s like magic!! Here is the incantation:
library(RCurl)
url <- "https://raw.githubusercontent.com/NicoleRadziwill/Data-"
url <- paste(url,"for-R-Examples/master/mnm-clean.csv",sep="")
x <- getURL(url,ssl.verifypeer=FALSE)
mnms <- read.csv(text = x)
R-bloggers.com offers daily e-mail updates about R news and tutorials about learning R and many other topics. Click here if you're looking to post or find an R/data-science job.
Want to share your content on R-bloggers? click here if you have a blog, or here if you don't.

