rNOMADS 2.0.2 released
Want to share your content on R-bloggers? click here if you have a blog, or here if you don't.
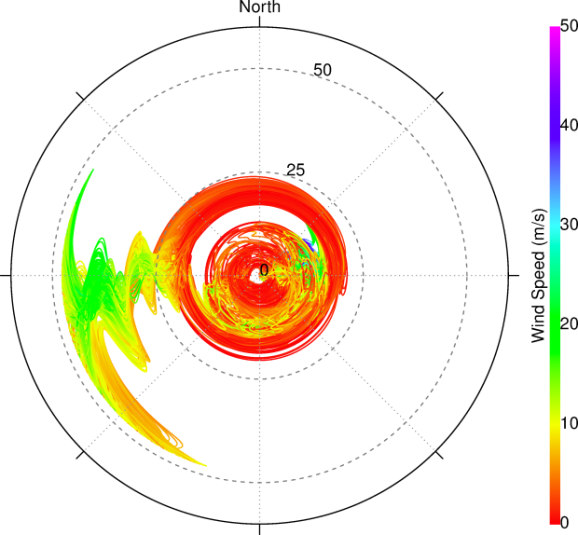
I uploaded the newest version of rNOMADS to CRAN yesterday. This one has a new plotting function for wind altitude azimuth, and magnitude (see below for plot and source code). I also added a function for reading GRIB inventories, fixed a few typos, and tweaked a few functions. In other news, the rNOMADS subversion repository has migrated to R-Forge: http://rnomads.r-forge.r-project.org/.
I’ve also set up an rNOMADS mailing list; subscribe here if you need to ask for help or want to hear about new releases.

Wind profiles at each infrasound station in the Transportable Array (currently on the US East Coast). Ground surface is at the center of the plot, the top of the stratosphere is at the outer radius. Wind magnitudes are denoted by color, and azimuth by position around the circle.
library(rNOMADS)

download.file("http://www.unc.edu/~haksaeng/rNOMADS/myTA.RDATA",
destfile = "myTA.RDATA")
load("myTA.RDATA")
#Find the latest Global Forecast System model run
model.urls <- GetDODSDates("gfs_hd")
latest.model <- tail(model.urls$url, 1)
model.runs <- GetDODSModelRuns(latest.model)
latest.model.run <- tail(model.runs$model.run, 1)

#Get model nodes

lons <- seq(0, 359.5, by = 0.5)
lats <- seq(-90, 90, by = 0.5)
lon.ind <- which(lons <= max(myTA$lon + 360) & lons >= min(myTA$lon + 360)) - 1
lat.ind <- which(lats <= max(myTA$lat) & lats >= min(myTA$lat)) - 1
levels <- c(0, 46)
time <- c(0, 0)

#Get data
hgt.data <- DODSGrab(latest.model, latest.model.run, "hgtprs",
    time, c(min(lon.ind), max(lon.ind)), c(min(lat.ind), max(lat.ind)), levels)
ugrd.data <- DODSGrab(latest.model, latest.model.run, "ugrdprs",
    time, c(min(lon.ind), max(lon.ind)), c(min(lat.ind), max(lat.ind)), levels)
vgrd.data <- DODSGrab(latest.model, latest.model.run, "vgrdprs",
    time, c(min(lon.ind), max(lon.ind)), c(min(lat.ind), max(lat.ind)), levels)

#Reformat the data
hgt.grid <- ModelGrid(hgt.data, c(0.5, 0.5))
ugrd.grid <- ModelGrid(ugrd.data, c(0.5, 0.5))
vgrd.grid <- ModelGrid(vgrd.data, c(0.5, 0.5))

#Build profiles
zonal.wind <- c()
meridional.wind <- c()
height >- c()
for(k in 1:length(myTA$lon)) {
     hgt.profile <- BuildProfile(hgt.grid,
         myTA$lon[k], myTA$lat[k], spatial.average = TRUE)
    ugrd.profile <- BuildProfile(ugrd.grid,
        myTA$lon[k], myTA$lat[k], spatial.average = TRUE)
    vgrd.profile <- BuildProfile(vgrd.grid,
        myTA$lon[k], myTA$lat[k], spatial.average = TRUE)
    synth.hgt <- seq(min(hgt.profile),
        max(hgt.profile), length.out = 1000)
    ugrd.spline <- splinefun(hgt.profile, ugrd.profile, method = "natural")
    vgrd.spline <- splinefun(hgt.profile, vgrd.profile, method = "natural")
    zonal.wind[[k]] <- ugrd.spline(synth.hgt)
    meridional.wind[[k]] <- vgrd.spline(synth.hgt)
    height[[k]] <- synth.hgt
     print(paste("Finished", k, "of", length(myTA$lon), "profiles!"))
}

#Plot them all
PlotWindProfile(zonal.wind, meridional.wind, height, lines = TRUE, points = FALSE,
    elev.circles = c(0, 25000, 50000), elev.labels = c(0, 25, 50), radial.lines = seq(45, 360, by = 45),
    colorbar = TRUE, invert = FALSE, point.cex = 2, pch = 19, lty = 1, lwd = 1,
    height.range = c(0, 50000), colorbar.label = "Wind Speed (m/s)", elev.labels.az = 15)
R-bloggers.com offers daily e-mail updates about R news and tutorials about learning R and many other topics. Click here if you're looking to post or find an R/data-science job.
Want to share your content on R-bloggers? click here if you have a blog, or here if you don't.
