
How to draw venn pie-agram (multi-layer pie chart) in R?
[This article was first published on One Tip Per Day, and kindly contributed to R-bloggers]. (You can report issue about the content on this page here)
Want to share your content on R-bloggers? click here if you have a blog, or here if you don't.
Want to share your content on R-bloggers? click here if you have a blog, or here if you don't.
I was wondering how to draw a venn diagram like pie chart in R, to show the distribution of my RNA-seq reads mapped onto different annotation regions (e.g. intergenic, intron, exons etc.). A google search returns several options, including the nice one from Xiaopeng’s bam2x (see below). However, he told me it’s not released yet. And it’s javascript based.

Why not I just make one in R?
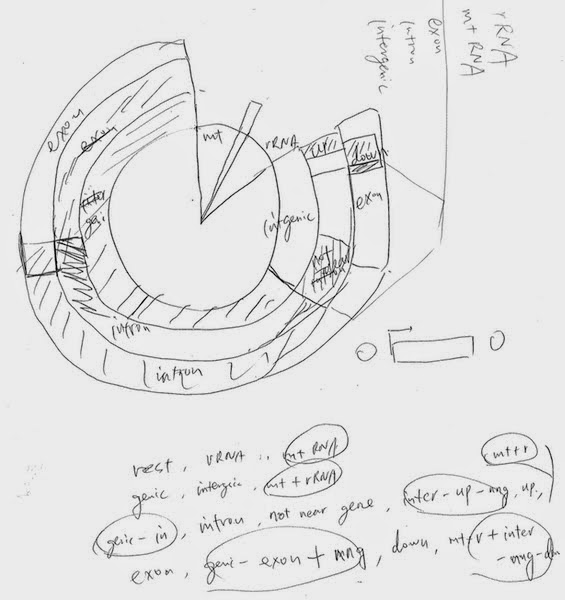
Here is the design scratch:
And here is example code:
Here is output:

You can also use par(mfrow=c(n,m)) to put multiple venn pieagram in one figure.
To leave a comment for the author, please follow the link and comment on their blog: One Tip Per Day.
R-bloggers.com offers daily e-mail updates about R news and tutorials about learning R and many other topics. Click here if you're looking to post or find an R/data-science job.
Want to share your content on R-bloggers? click here if you have a blog, or here if you don't.