A Brief Introduction to Plotly
Want to share your content on R-bloggers? click here if you have a blog, or here if you don't.
This is a guest post by Matt Sundquist. Matt studied philosophy at Harvard and is a Co-founder at Plotly. He previously worked for Facebook’s Privacy Team, has been a Fulbright Scholar in Argentina and a Student Fellow of the Harvard Law School Program on the Legal Profession, and wrote about the Supreme Court for SCOTUSblog.com.
Emailing code, data, graphs, files, and folders around is painful (see below). Discussing all these different objects and translating between languages, versions, and file types makes it worse. We’re working on a project called Plotly aimed at solving this problem. The goal is to be a platform for delightful, web-based, language-agnostic plotting and collaboration. In this post, we’ll show how it works for ggplot2 and R.

A first Plotly ggplot2 plot
Let’s make a plot from the ggplot2 cheatsheet. You can copy and paste this code or sign-up for Plotly and get your own key. It’s free, you own your data, and you control your privacy (the set up is quite like GitHub).
install.packages("devtools") # so we can install from github
library("devtools")
install_github("ropensci/plotly") # plotly is part of the ropensci project
library(plotly)
py <- plotly("RgraphingAPI", "ektgzomjbx")  # initiate plotly graph object

library(ggplot2)
library(gridExtra)
set.seed(10005)

xvar <- c(rnorm(1500, mean = -1), rnorm(1500, mean = 1.5))
yvar <- c(rnorm(1500, mean = 1), rnorm(1500, mean = 1.5))
zvar <- as.factor(c(rep(1, 1500), rep(2, 1500)))
xy <- data.frame(xvar, yvar, zvar)
plot<-ggplot(xy, aes(xvar)) + geom_histogram()
py$ggplotly()  # add this to your ggplot2 script to call plotly
By adding the final line of code, I get the same plot drawn in the browser. It’s here: https://plot.ly/~MattSundquist/1899, and also shown in an iframe below. If you re-make this plot, you’ll see that we’ve styled it in Plotly’s GUI. Beyond editing, sharing, and exporting, we can also add a fit. The plot is interactive and drawn with D3.js, a popular JavaScript visualization library. You can zoom by clicking and dragging, pan, and see text on the hover by mousing over the plot.
Here is how we added a fit and can edit the figure:
Your Rosetta Stone for translating figures

- https://plot.ly/~MattSundquist/1899.svg
- https://plot.ly/~MattSundquist/1899.png
- https://plot.ly/~MattSundquist/1899.pdf
- https://plot.ly/~MattSundquist/1899.py
- https://plot.ly/~MattSundquist/1899.r
- https://plot.ly/~MattSundquist/1899.m
- https://plot.ly/~MattSundquist/1899.jl
- https://plot.ly/~MattSundquist/1899.json
- https://plot.ly/~MattSundquist/1899.embed

py <- plotly("ggplot2examples", "3gazttckd7")
figure <- py$get_figure("MattSundquist", 1339)
str(figure)
figure$data[]
That routine is possible from other languages and any plots. You can share figures and data between a GUI, Python, R, MATLAB, Julia, Excel, Dropbox, Google Drive, and SAS files.
Three Final thoughts
- Why did we build wrappers? Well, we originally set out to build our own syntax. You can use our syntax, which gives you access to the entirety of Plotly’s graphing library. However, we quickly heard from folks that it would be more convenient to be able to translate their figures to the web from libraries they were already using.
- Thus, Plotly has APIs for R, Julia, Python, MATLAB, and Node.js; supports LaTeX; and has figure converters for sharing plots from ggplot2, matplotlib, and Igor Pro. You can also translate figures from Seaborn, prettyplotlib, and ggplot for Python, as shown in this IPython Notebook. Then if you’d like to you can use our native syntax or the GUI to edit or make 3D graphs and streaming graphs.
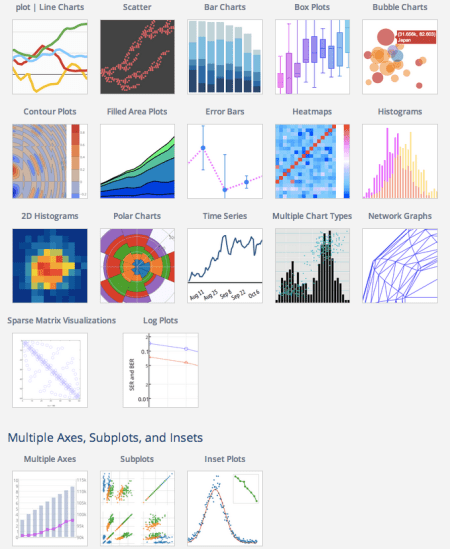
- We’ve tried to keep the graphing library flexible. So while Plotly doesn’t natively support network visualizations (see what we support below), you can make them with MATLAB and Julia, as Benjamin Lind recently demonstrated on this blog. The same is true with maps. If you hit a wall, have feedback, or have questions, let us know. We’re at feedback at plot dot ly and @plotlygraphs.
R-bloggers.com offers daily e-mail updates about R news and tutorials about learning R and many other topics. Click here if you're looking to post or find an R/data-science job.
Want to share your content on R-bloggers? click here if you have a blog, or here if you don't.


