

[This article was first published on CoolStatsBlog » R, and kindly contributed to R-bloggers]. (You can report issue about the content on this page here)
Want to share your content on R-bloggers? click here if you have a blog, or here if you don't.
Want to share your content on R-bloggers? click here if you have a blog, or here if you don't.
Recently, Greg Laughlin, the founder of a new statistical software called Statwing, let me try his product for free. I happen to like free things very much (the college student is strong within me) so I gave it a try.

I mostly like how easy it is to use: For instance, to relate two attributes like Age and Income, you click Age, click Income, and click Relate.
So what can Statwing do?
- Summarize an attribute (like “age”): totals, averages, standard deviation, confidence intervals, percentiles, visual graphs like the one below

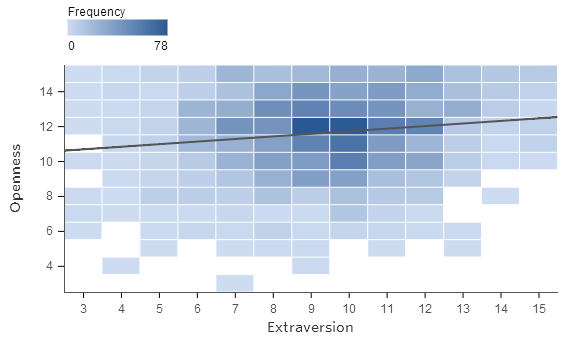
- Relate two columns together (“Openness” vs “Extraversion”)

- Plots the two attributes against eachother to see how they relate. It will include the formula of the regression line and the R-squared value.
- Sometimes a chi-square-style table is more appropriate. The software determines how best to represent the data.

- Tests the null hypothesis that the attributes are independent, by a T-test, F-test (ANOVA) or chi-square test. Statwing determines which one is appropriate.
- Repeat the above for a ranked correlation.


For now, you can’t forecast a time series or represent data on maps. But Greg told me that the team is adding new features as I type this.
If you’d like to try the software yourself, click here. They’ve got three sample datasets to play with:
- Titanic passengers information
- The results of a psychological survey
- A list of congressman, their voting record and donations.


To leave a comment for the author, please follow the link and comment on their blog: CoolStatsBlog » R.
R-bloggers.com offers daily e-mail updates about R news and tutorials about learning R and many other topics. Click here if you're looking to post or find an R/data-science job.
Want to share your content on R-bloggers? click here if you have a blog, or here if you don't.