Analysing squash performance using fitbit data
Want to share your content on R-bloggers? click here if you have a blog, or here if you don't.
I previously wrote about accessing step data in R using the fitbit API and at the time said I could think of little to do with the data that was not available via the fitbit website. Since then I’ve rejoined the local squash league and thought that I might be able to learn something useful from an integration of my step counts and performance at squash. The hope is that whatever I learn can be used to inform my game plan and so improve my performance; it certainly can’t hurt!
In that first post I used the fitbit API to access daily step totals, but that isn’t going to be too useful here – I need the data for the period of the squash game itself. It turns out that fitbit don’t let any old programmer access the “intra-day” data, presumably to stop you ripping off their premium account. However, they were willing to let me have access to the intra-day data via the API on the basis that this is a personal project. Kudos fitbit. I won’t bother showing any code here as it’s all in R and simply an extension of my previous post, but you can place an intra-day GET request which will either return the whole day’s data in 1 or 15 minute bins. You can also specify a particular time period that you want.
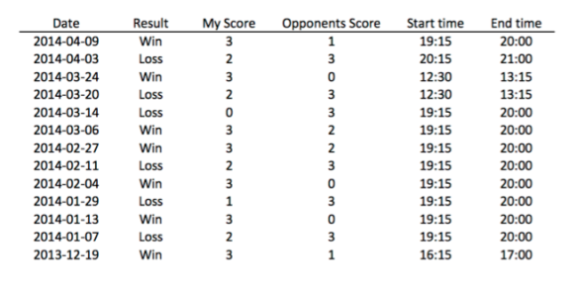
Luckily for this purpose I’m sad enough to track the date, time, result and score of every game of squash I play. I’ve been playing for 3 months now and have data for 11 matches; 6 wins and 5 losses. There were also a few games during which I didn’t wear my tracker (wins of course!) for various silly reasons but I have excluded them from the analysis.
Below I plot the per minute step count for each game (transparent lines) coloured green for a win and red for a loss. I then fit a loess curve to the data for each outcome (win or lose) which is shown by the bold dashed lines.
What does it tell me?
- I seem to peak at around 100 steps per minute, which seems like a lot but I don’t have anything/body to compare this to. Would love to see what a professional game looks like.
- There are four dramatic reductions in step counts; one at 8 minutes, two at about 28 minutes and then another at 36 minutes. The first I think represents a quick injury break (sprained ankle), the second two correspond to games I won quickly by 3-0 so the dip is whilst we shake hands and decide to play on for the rest of the court time. The third dip is a game I lost 1-3, so clearly I put up enough of a fight to make the game last a little bit longer than a 3-0 drubbing.
- The fitted lines reveal that I maintain a higher intensity for longer in the games that I win. At 30 minutes in this is about an extra 10 steps per minute. If I’m doing 100 steps per minute then this is a 10% upping of my intensity level.
- My intensity levels start higher when I win and drop faster when I’m losing.
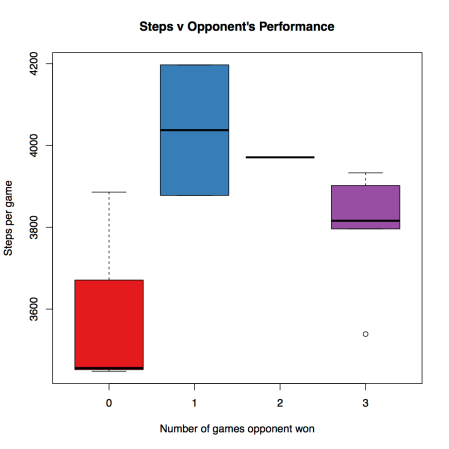
There is more to be had form this data; for example the above does not take into account the winning/losing margin. To demonstrate, the plot below shows the total number of steps I make per match (regardless of the outcome) bucketed by the number of games (squash is first to 3) that my opponent won. It’s clear that when my opponent wins no games its a bit of a walkover and I put less effort in. Conversely when the game is close and my opponent wins one or two games I have to put in a bit of extra effort to win. And as we saw above, when I lose I put less effort in.
So, the lesson – fight harder and faster!
R-bloggers.com offers daily e-mail updates about R news and tutorials about learning R and many other topics. Click here if you're looking to post or find an R/data-science job.
Want to share your content on R-bloggers? click here if you have a blog, or here if you don't.


