A slightly different introduction to R, part V: plotting and simulating linear models
Want to share your content on R-bloggers? click here if you have a blog, or here if you don't.
In the last episode (which was quite some time ago) we looked into comparisons of means with linear models. This time, let’s visualise some linear models with ggplot2, and practice another useful R skill, namely how to simulate data from known models. While doing this, we’ll learn some more about the layered structure of a ggplot2 plot, and some useful thing about the lm function.
11. Using points, lines and error bars to show predictions from linear models
Return to the model of comb gnome mass at time zero. We’ve already plotted the coefficient estimates, but let us just look at them with the coef() function. Here the intercept term is the mean for green comb gnomes subjected to the control treatment. The ‘grouppink’ and ‘treatmentpixies’ coefficients are the mean differences of pink comb gnomes and comb gnomes exposed to pixies from this baseline condition. This way of assigning coefficients is called dummy coding and is the default in R.
model <- lm(mass0 ~ group + treatment, data)
coef(model)[1]
    (Intercept)       grouppink treatmentpixies
      141.56771       -49.75414        23.52428
The estimate for a pink comb gnome with pixies is:
coef(model)[1] + coef(model)[2] + coef(model)[3]
There are alternative codings (”contrasts”) that you can use. A common one in Anova is to use the intercept as the grand mean and the coefficients as deviations from the mean. (So that the coefficients for different levels of the same factor sum to zero.) We can get this setting in R by changing the contrasts option, and then rerun the model. However, whether the coefficients are easily interpretable or not, they still lead to the same means, and we can always calculate the values of the combinations of levels that interest us.
Instead of typing in the formulas ourself as above, we can get predictions from the model with the predict( ) function. We need a data frame of the new values to predict, which in this case means one row for each combination of the levels of group and treatment. Since we have too levels each there are only for of them, but in general we can use the expand.grid( ) function to generate all possible factor levels. We’ll then get the predictions and their confidence intervals, and bundle everything together to one handy data frame.
levels <- expand.grid(group=c("green", "pink"), treatment=c("control", "pixies"))
predictions <- predict(model, levels, interval="confidence")
predicted.data <- cbind(levels, predictions)
  group treatment       fit       lwr      upr
1 green   control 141.56771 125.82527 157.3101
2  pink   control  91.81357  76.48329 107.1439
3 green    pixies 165.09199 149.34955 180.8344
4  pink    pixies 115.33785  98.93425 131.7414
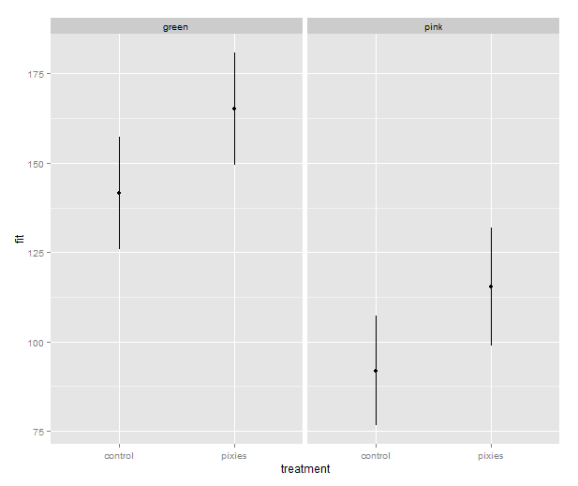
Now that we have these intervals in a data frame we can plot them just like we would any other values. Back in part II, we put several categorical variables into the same plot by colouring the points. Now, let’s introduce nice feature of ggplot2: making small multiples with faceting. qplot( ) takes facets argument which is a formula where the left hand side, before the tilde (‘~’), will be used to split the plot vertically, and the right hand side will split the plot horizontally. In this case, we split horizontally, each panel representing one level of the treatment variable. Also, we use a new geometry: pointrange, which draws a point with bars above and below it and is quite suitable for the intervals we’ve got.
qplot(x=treatment, facets=~group,
      y=fit, ymax=upr, ymin=lwr
      geom="pointrange", data=predicted.data)
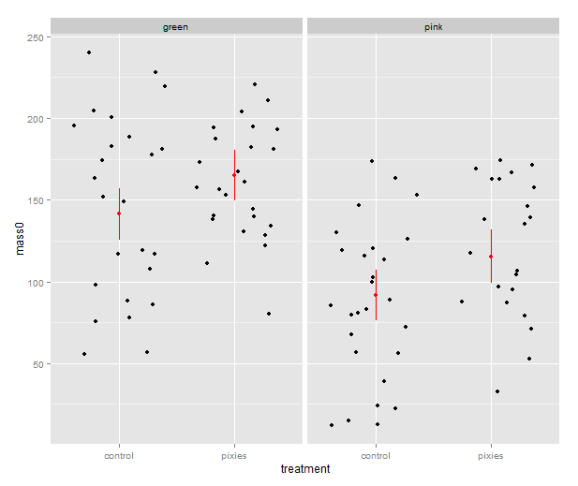
That’s good, but combining the predictions from the model and the actual data in the same plot would be nice. In ggplot2, every plot is an object that can be saved away to a variable. Then we can use the addition operator to add layers to the plot. Let’s make a jittered dotplot like the above and then add a layer with the pointrange geometry displaying confidence intervals. The scatter of the data points around the confidence intervals reminds us that there is quite a bit of residual variance. The coefficient of determination, as seen in the summary earlier, was about 0.25.
qplot(x=treatment, y=mass0, facets=~group, geom="jitter", data=data) +
    geom_pointrange(aes(y=fit, ymax=upr, ymin=lwr), colour="red", data=predicted.data)
In the above, we make use of ggplot2′s more advanced syntax for specifying plots. The addition operator adds layers. The first layer can be set up with qplot(), but the following layers are made with their respective functions. Mapping from variables to features of the plot, called aesthetics, have to be put inside the aes() function. This might look a bit weird in the beginning, but it has its internal logic — all this is described in Hadley Wickham’s ggplot2 book.
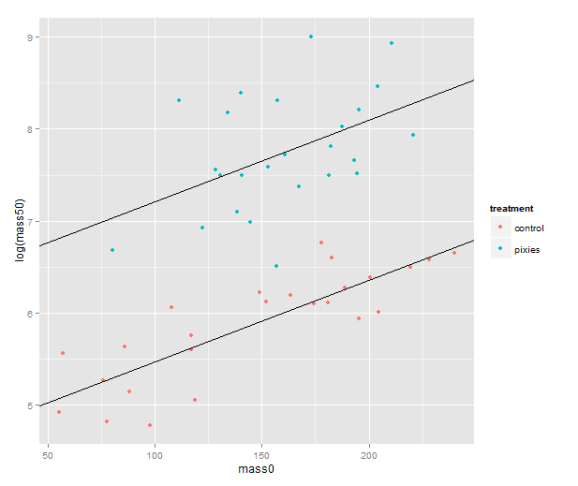
We should probably try a regression line as well. The abline geometry allows us to plot a line with given intercept and slope, i.e. the coefficients of a simple regression. Let us simplify a little and look at the mass at time zero and the log-transformed mass at time 50 in only the green group. We make a linear model that uses the same slope for both treatments and a treatment-specific intercept. (Exercise for the reader: look at the coefficients with coef( ) and verify that I’ve pulled out the intercepts and slope correctly.) Finally, we plot the points with qplot and add the lines one layer at the time.
green.data <- subset(data, group=="green")
model.green <- lm(log(mass50) ~ mass0 + treatment, green.data)
intercept.control <- coef(model.green)[1]
intercept.pixies <- coef(model.green)[1]+coef(model.green)[3]
qplot(x=mass0, y=log(mass50), colour=treatment, data=green.data) +
   geom_abline(intercept=intercept.pixies, slope=coef(model.green)[2]) +
   geom_abline(intercept=intercept.control, slope=coef(model.green)[2])
12. Using pseudorandom numbers for sanity checking
There is a short step from playing with regression functions that we’ve fitted, like we did above, to making up hypothetical regression functions and simulating data from them. This type of fake-data simulation is very useful to for testing how designs and estimation procedures behave and check things like the control of false positive rate and the power to accurately estimate a known model.
The model will be the simplest possible: a single categorical predictor with only two levels and normally distributed equal error variance, i.e. a t-test. There is a formula for the power of the t-test and an R function, power.t.test( ), that calculates it for us without the need for simulation. However, a nice thing about R is that we can pretty easily replace the t-test with more complex procedures. Any model fitting process that you can program in R can be bundled into a function and applied to pseudorandom simulated data. In the next episode we will go into how to make functions and apply them repeatedly.
Let us start out with a no effect model: 50 observations in two groups drawn from the same distribution. We use the mean and variance of the green control group. This first part just sets up the variables:
mu <- mean(subset(data, group=="green" & treatment=="control")$mass0)
sigma <- sd(subset(data, group=="green" & treatment=="control")$mass0)
treatment <- c(rep(1, 50), rep(0, 50))
The rnorm( ) function generates numbers from a normal distribution with specified mean and standard deviation. Apart from drawing numbers from it, R can of course pull out various table values, and it knows other distributions as well. Look at the documentation in ?distributions. Finally we perform a t-test. Most of the time, it should not show a significant effect, but sometimes it will.
sim.null <- rnorm(100, mu, sigma)
t.test(sim.null ~ treatment)$p.value
We can use the replicate( ) function to evaluate an expression multiple times. We put the simulation and t-test together into one expression, rinse and repeat. Finally, we check how many of the 1000 replicates gave a p-value below 0.05. Of course, it will be approximately 5% of them.
sim.p <- replicate(1000, t.test(rnorm(100, mu, sigma) ~ treatment)$p.value)
length(which(sim.p < 0.05))/1000
[1] 0.047
Let us add an effect! Say we’re interested in an effect that we expect to be approximately half the difference between the green and pink comb gnomes:
d <- mean(subset(data, group=="green" & treatment=="control")$mass0) -
     mean(subset(data, group=="pink" & treatment=="control")$mass0)
sim.p.effect <- replicate(1000, t.test(treatment * d/2 +
                                       rnorm(100, mu, sigma) ~ treatment)$p.value)
length(which(sim.p.effect < 0.05))/1000
[1] 0.737
We see that with 50 individuals in each group and this effect size we will detect a significant difference about 75% of the time. This is the power of the test. If you are able to find nice and trustworthy prior information about the kind of effect sizes and variances you expect to find in a study, design analysis allows you to calculate for instance how big a sample you need to have good power. Simulation can also give you an idea of how badly a statistical procedure will break if the assumptions don’t hold. We can try to simulate a situation where the variances of the two groups differs quite a bit.
sim.unequal <- replicate(1000, t.test(c(rnorm(50, mu, sigma),
                                        rnorm(50, mu, 2*sigma)) ~ treatment)$p.value)
length(which(sim.unequal < 0.05))/1000
[1] 0.043
sim.unequal.effect <- replicate(1000, t.test(c(rnorm(50, mu+d/2, sigma),
                                               rnorm(50, mu, 2*sigma)) ~ treatment)$p.value)
length(which(sim.unequal.effect < 0.05))/1000
[1] 0.373
In conclusion, the significance is still under control, but the power has dropped to about 40%. I hope that has given a small taste of how simulation can help with figuring out what is going on in our favourite statistical procedures. Have fun!
Postat i:computer stuff, data analysis, english Tagged: ggplot2, lm, R, simulation, tutorial
R-bloggers.com offers daily e-mail updates about R news and tutorials about learning R and many other topics. Click here if you're looking to post or find an R/data-science job.
Want to share your content on R-bloggers? click here if you have a blog, or here if you don't.


