Want to share your content on R-bloggers? click here if you have a blog, or here if you don't.
The Area Under the Receiver Operator Curve is a commonly used metric of model performance in machine learning and many other binary classification/prediction problems. The idea is to generate a threshold independent measure of how well a model is able to distinguish between two possible outcomes. Threshold independent here just means that for any model which makes continuous predictions about binary outcomes, the conversion of the continuous predictions to binary requires making the choice of an arbitrary threshold above which will be a prediction of 1, below which will be 0.
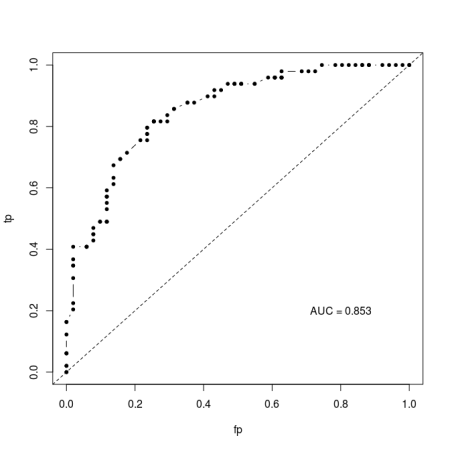
AUC gets around this threshold problem by integrating across all possible thresholds. Typically, it is calculated by plotting the rate of false positives against false negatives across the range of possible thresholds (this is the Receiver Operator Curve) and then integrating (calculating the area under the curve). The result is typically something like this:
I’ve implemented this algorithm in an R script (https://gist.github.com/cjbayesian/6921118) which I use quite frequently. Whenever I am tasked with explaining the meaning of the AUC value however, I will usually just say that you want it to be 1 and that 0.5 is no better than random. This usually suffices, but if my interlocutor is of the particularly curious sort they will tend to want more. At which point I will offer the interpretation that the AUC gives you the probability that a randomly selected positive case (1) will be ranked higher in your predictions than a randomly selected negative case (0).
Which got me thinking – if this is true, why bother with all this false positive, false negative, ROC business in the first place? Why not just use Monte Carlo to estimate this probability directly?
So, of course, I did just that and by golly it works.
source("http://polaris.biol.mcgill.ca/AUC.R")
bs<-function(p)
{
 U<-runif(length(p),0,1)
 outcomes<-U<p
 return(outcomes)
}

# Simulate some binary outcomes #
n <- 100
x <- runif(n,-3,3)
p <- 1/(1+exp(-x))
y <- bs(p)

# Using my overly verbose code at https://gist.github.com/cjbayesian/6921118
AUC(d=y,pred=p,res=500,plot=TRUE)

## The hard way (but with fewer lines of code) ##
N <- 10000000
r_pos_p <- sample(p[y==1],N,replace=TRUE)
r_neg_p <- sample(p[y==0],N,replace=TRUE)

# Monte Carlo probability of a randomly drawn 1 having a higher score than
# a randomly drawn 0 (AUC by definition):

rAUC <- mean(r_pos_p > r_neg_p)
print(rAUC)
By randomly sampling positive and negative cases to see how often the positives have larger predicted probability than the negatives, the AUC can be calculated without the ROC or thresholds or anything. Now, before you object that this is necessarily an approximation, I’ll stop you right there – it is. And it is more computationally expensive too. The real value for me in this method is for my understanding of the meaning of AUC. I hope that it has helped yours too!
R-bloggers.com offers daily e-mail updates about R news and tutorials about learning R and many other topics. Click here if you're looking to post or find an R/data-science job.
Want to share your content on R-bloggers? click here if you have a blog, or here if you don't.

