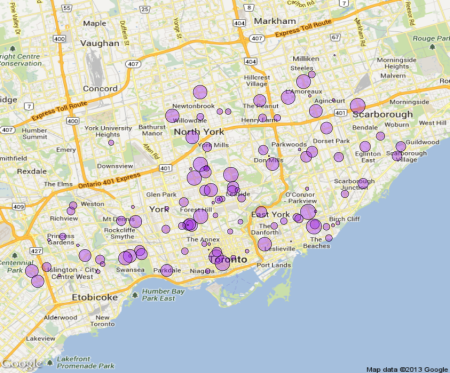
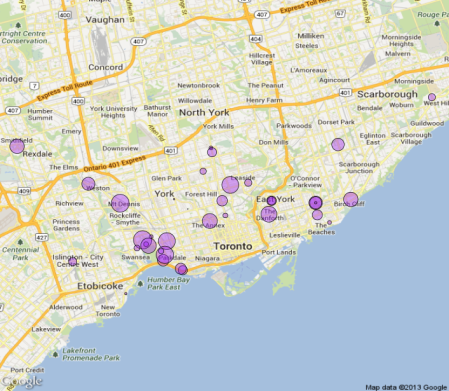
Big and small daycares in Toronto by building type, mapped using RGoogleMaps and Toronto Open Data
Want to share your content on R-bloggers? click here if you have a blog, or here if you don't.
Before my daughter was born, I thought that my wife and I would have to send her to a licensed child care centre somewhere in Toronto. I had heard over and over how long of a waiting list I should expect the centre to have, and so we’d better get her registered nice and early! Well, it turns out that we found an excellent unlicensed home day care which she’s been at for two years now. So when I recently went on Toronto Open Data’s website and found a dataset of licensed child care centres throughout Toronto, I thought I might have a fun time analyzing a topic that I thankfully have not had to deal with thus far!
If you look in the dataset (or in the documentation for the dataset) you’ll see that it contains names, addresses, phone info, building type, number of spaces in the daycare (broken down into age categories, and then totalled up) and unprojected latitude/longitude coordinates. This dataset literally begged me to map it, but it also begged me to use one of the number of spaces variables in a map as well!
The process which I used to create the maps is very similar to the maps I made when I was analyzing the Toronto Casino Feedback Form (Survey), except in the maps I’ve put in this post, the dots are bigger or smaller depending on the percentiles of a quantitative variable (in this case the total number of spaces in the child care centres of a particular building type). You can find the R code I used to generate these maps and stats at the bottom of this post.
This is meant strictly as an exploratory exercise. To provide further informative clarity for this exercise, I’ve created multiple maps where each map shows locations of child care centres from one building type (e.g. Places of Worship, Public Elementary Schools, High Rise Buildings, etc.). As I describe each map, I’ll also refer to descriptive stats that I’ve calculated and displayed at the bottom of this post (after all of the R code). If you look at the table at the bottom of this post, you’ll notice there were more building types than I’ve mapped here. That’s because I didn’t feel like mapping everything, only some of the most popular ones ![]()
Public Elementary Schools are by far the most popular type of building in which the licensed child care centres in this dataset are found (279 centres, according to the data). Looking at the map below, you can see that there is a very dense cluster of public elementary school child care centres in the core of the GTA (down-town Toronto, and North York). As you go west towards Etobicoke and Rexdale, you definitely see fewer centres, and then in Scarborough you also see few centres, but they appear to be more dispersed and less clustered than in the other areas. There’s a lot of variability in the number of spaces in these child care centres, ranging from a minimum of 15 to a maximum of 217, with the average number of spaces per public elementary school child care centres being around 74 spaces per centre.
Places of Worship, as you can see below, are far less numerous than their public elementary school counterparts, with only 116 registered in this dataset. The first thing that I noticed with this map is that most of the small dots (thus the smaller child care centres in places of worship) seem to fall in the south of the GTA, rather than the north. I suppose that makes sense to me in an analogical kind of a way. In the north of the GTA (where I live) a lot of the businesses are big chains that seek to serve as many people as possible, whereas downtown there are a lot of smaller businesses that serve a niche market. Perhaps it’s a similar story with child care centres in places of worship as well.
On a side note, the vast majority of the places of worship mentioned in this dataset were of Christian or Catholic denominations. I was perhaps surprised not to find too many synagogues in there, but that might just be my bias speaking!
Child care centres in places of worship ranged from having a minimum of 8 spaces to a maximum of 167 with an average of about 48 spaces per centre.

High Rise child care centres seem to show a pretty distinctive geographical pattern, as you can see below! They seem to either be in the east of Toronto, near or beyond highway 404, or the west of Toronto, most of them beyond Allen Road/Dufferin Street. I wonder what accounts for what looks like this hole in the middle!? Also, you’ll notice that many of the smaller high rise child care centres are in the east of Toronto, rather than the West. High rise child care centres range from having a minimum of 20 spaces to a maximum of 145, with an average of about 69 spaces per centre. You’ll notice that the minimum number of spaces is higher than other categories, probably accounted for by the fact that they are likely serving many residents in their own high rise building!

Purpose Buildings, or buildings that were created with the child care centre in mind, are fairly sparse throughout Toronto, with only 58 in the dataset. In terms of clusters here, it almost looks like you could delineate 4 clusters of buildings: North, South, East, and West. Purpose buildings range from having a minimum of 20 spaces to a maximum of 165 with an average of about 72 spaces per centre (however median is 60, suggesting that there are a few really big ones in there, relative to all the rest). Outliers aside, it seems that purpose buildings are like high rise daycares, in that they are meant for higher capacity than other centres.

Community and Recreation Centres with child care seem to almost show a circle pattern in how they are laid out around the GTA. The obvious exceptions are in Scarborough, which seems to have very few community and recreation centres with child care compared to what’s going on in the west. Perhaps mirroring the phenomenon we saw with child care centres in places of worship, a lot of the smaller community and recreation centres with child care are in the south, whereas the north is the domain of bigger centres. These centres range from having a minimum of 13 spaces to a maximum of 146, with an average of about 64 spaces per centre.

Although child care centres in Houses seem to show a very random looking pattern, I can’t help but notice that there are more than a few centres within a close proximity to the Go Train tracks emanating from Union Station. Perhaps there’s an interesting story there, or maybe I’m just seeing patterns than don’t exactly mean anything (after all, there are just 38 of these places registered in the dataset!). Child care centres in houses range from having a minimum of 10 spaces to a maximum of 116, with an average of about 50 spaces per centre. I do have to wonder how exactly these houses fit so many kids. Seeing as how we are living in a post google street view world, you can just look at whatever house you want in living colour by typing in the address. You can see how big on of these houses is (it has 87 spaces!) below the following map.


Wow! It’s not a full picture, but you get the sense that the house really is quite big!
Well, so concludes my foray into the world of licensed child care centres. If you have any commentary to add regarding these results, or can show me a better way of mapping them (although I do like RGoogleMaps), then by all means leave me a comment! R code is shared below.
R-bloggers.com offers daily e-mail updates about R news and tutorials about learning R and many other topics. Click here if you're looking to post or find an R/data-science job.
Want to share your content on R-bloggers? click here if you have a blog, or here if you don't.

