Profiling R code
Want to share your content on R-bloggers? click here if you have a blog, or here if you don't.
Profiling R code gives you the chance to identify bottlenecks and pieces of code that needs to be more efficiently implemented [1].
Profiling R code is usually the last thing I do in the process of package (or function) development. In my experience we can reduce the amount of time necessary to run an R routine by as much as 90% with very simple changes to our code. Just yesterday I reduced the time necessary to run one of my functions from 28 sec. to 2 sec. just by changing one line of the code from
x = data.frame(a = variable1, b = variable2)
to
x = c(variable1, variable2)
This big reduction happened because this line of code was called several times during the execution of the function.
Rprof and summaryRprof approach
The standard approach to profile R code is to use the Rprof function to profile and the summaryRprof function to summarize the result.
Rprof("path_to_hold_output")
## some code to be profiled
Rprof(NULL)
## some code NOT to be profiled
Rprof("path_to_hold_output", append=TRUE)
## some code to be profiled
Rprof(NULL)

# summarize the results
summaryRprof("path_to_hold_output")
Rprof works by recording at fixed intervals (by default every 20 msecs) which R function is being used, and recording the results in a file. summaryRprof will give you a list with four elements:
- by.self: time spent in function alone.
- by.total: time spent in function and callees.
- sample.interval: the sampling interval, by default every 20 msecs.
- sampling.time: total time of profiling run. Remember that profiling does impose a small performance penalty.
Profiling short runs can be misleading, so in this case I usually use the replicate function
# Evaluate shortFunction() for 100 times
replicate(n = 100, shortFunction())
R performs garbage collection from time to time to reclaim unused memory, and this takes an appreciable amount of time which profiling will charge to whichever function happens to provoke it. It may be useful to compare profiling code immediately after a call to gc() with a profiling run without a preceding call to gc [1].
Example
A short default example collected from the help files is
Rprof(tmp <- tempfile())
example(glm)
Rprof()
summaryRprof(tmp)
which returns the following output:
$by.self
                self.time self.pct total.time total.pct
"print.default"      0.04    18.18       0.04     18.18
"glm.fit"            0.02     9.09       0.04     18.18
"all"                0.02     9.09       0.02      9.09
"<Anonymous>"        0.02     9.09       0.02      9.09
...

$by.total
                       total.time total.pct self.time self.pct
"example"                    0.22    100.00      0.00     0.00
"source"                     0.20     90.91      0.00     0.00
"eval"                       0.12     54.55      0.00     0.00
"print"                      0.12     54.55      0.00     0.00
...

$sample.interval
[1] 0.02

$sampling.time
[1] 0.22
Alternative approaches
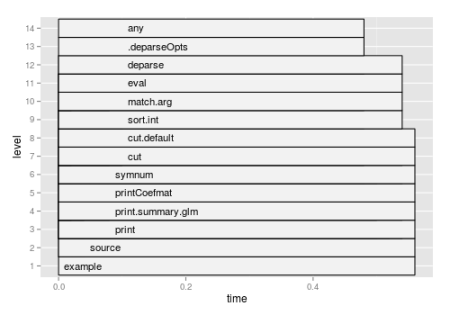
To be honest, Rprof and summaryRprof functions have served me well so far. But there are other complementary tools for profiling R code. For example, the packages profr and proftools provide graphical tools. Following are two types of graphs they can produce using the same simple example above.
The following code uses profr package and produces Figure 1.
require(profr)
require(ggplot2)
x = profr(example(glm))
ggplot(x)
The following code uses proftools package and produces Figure 2. Although it is hard to see, there are function names within each node in Figure 2. If you save the picture as a pdf file and zoom in you can actually read the names clearly, which might be useful to visually identify which function is a bottleneck in your code.
Rprof(tmp <- tempfile())
example(glm)
Rprof()
plotProfileCallGraph(readProfileData(tmp),
                     score = "total")

Figure 2. proftools example that uses Graphviz type graph to represent the dynamics of the function call that you are profiling. Color is used to encode the fraction of total or self time spent in each function or call.
To successfully use proftools you need to make sure you have Rgraphviz properly installed. You need to install it directly from the bioconductors site [2]:
source("http://bioconductor.org/biocLite.R")
biocLite("Rgraphviz")
References:
[1] Tidying and profiling R code chapter of the Writing R Extensions manual.
[2] See http://www.bioconductor.org/install/
Further reading:
- I suggest to follow the development of Hadley Wickham’s Profiling and benchmarking chapter of the Advanced R programming book which is currently under construction.
- Introduction to High-Performance Computing with R from Dirk Eddelbuettel has a nice section on profiling R code.
- A Case Study in Optimising Code in R from Jeromy Anglim’s Blog.
R-bloggers.com offers daily e-mail updates about R news and tutorials about learning R and many other topics. Click here if you're looking to post or find an R/data-science job.
Want to share your content on R-bloggers? click here if you have a blog, or here if you don't.

