Trends in the Analytics Job Market
Want to share your content on R-bloggers? click here if you have a blog, or here if you don't.
Tracking the job market for statistics, analytics, data mining and the like used to be a major undertaking. However, on November 10, 2011 the world’s largest web site for job postings, Indeed.com, released a tool that allows you to examine trends of your own choosing. David Smith, of Revolution Analytics, recently used this tool to compare the job markets for SAS, R, SPSS and even COBOL.
As easy as this tool is to use, some things are inherently difficult to search for. The name of the fastest growing analytics package, R, is not easy to separate from all sorts of other uses of that letter. Adding logical conditions to the search will help get a more relevant answer, but there is no perfect search for this software. For example, adding “statistics,” as David did helps a lot, but it includes jobs that use statistics (but not R) for the extremely popular job categories:
R&D = Research and Development
H.R. = Human Resources
A/R = Accounts Receivable
In studying the results of many types of searches previously, I settled on a very long query that depended on R appearing in sentences like, “the successful job applicant will have expertise in SAS, SPSS or R.” Commas are ignored in Indeed.com searches, so I used the strings “SAS R”, “R SAS”, “R or SAS”, or “SAS or R”. In addition to SAS, I used the languages: Java, Minitab, Perl, Python, Ruby, SAS, SPSS, SQL and Stata. Unfortunately Indeed’s trend tool does not allow multiple long queries. As a result, my final query is as follows:
“r sas” or “sas r” or “r or sas” or “sas or r” or “r spss” or “spss r” or “r or spss” or “spss or r” or “r stata” or “stata r” or “r or stata” or “stata or r” or “r minitab” or “minitab r” or “r or minitab” or “minitab or r”
Note the confusing use of the word “or”. Outside of quotes, it’s a logical specification as in: X or Y. Withing quotes however, it becomes part of the search string itself, where the job description includes the word “or”. From this point onward when I talk about software, “used for statistical purposes,” I am referring to this precise definition (substituting the package at hand into the query, of course).
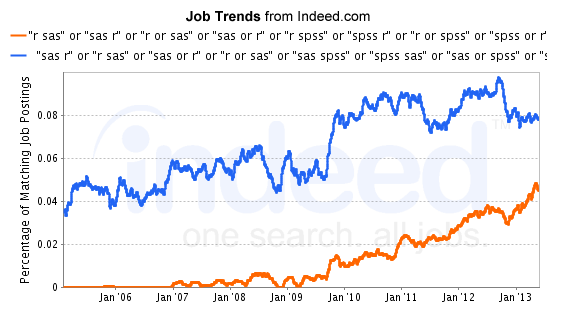
Even with this shortened search string, only two at a time would fit into Indeed’s search. Figure 1 shows the plot comparing R and SAS.

Figure 1. The percentage of job postings across time for SAS and R. Both are focused on statistical uses via complex query.
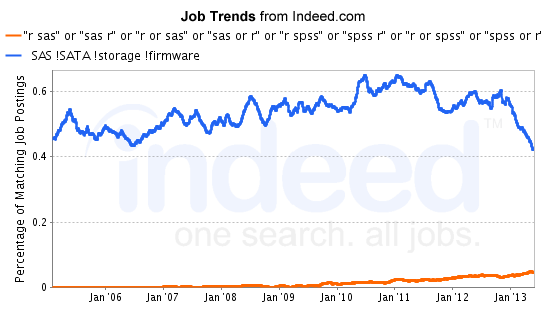
We see that there is an overall pattern of growth for SAS. However, the growth seems to have stagnated from January, 2010 onward. At the most current time-point, the percentage of jobs for SAS is twice as high as for R. That 2-to-1 ratio is far smaller than I reported as recently as two months ago. Why the change? I had previously used complex logic to find R and simpler logic to find SAS. SAS is much easier to find, but by using simpler logic, I was essentially comparing R use for statistics to SAS use for all purposes. While that may sound like an irrelevant comparison, it is one that helps to show that R competes with SAS not just for statistical use, but also for its use in general data processing, report writing and related non-analytic tasks. Once a company is using SAS for report writing, they are more likely to use it for at least the fundamental statistics that come with Base SAS at no additional cost. Below is a graph (Fig. 2) comparing the search string “SAS !SATA !storage !firmware” to the complex R string from above. The exclamation point excludes terms, and the letters S.A.S. also stand for SCSI Attached Storage, which is related to computer firmware, not statistics. As a result, those jobs are excluded from the search.

Figure 2. Percentage of job postings across time for all uses of SAS compared to only statistical uses of R.
We see that the number of jobs for SAS is now far more dominant than before. It’s difficult to assess from the graph but a direct job search shows there are 9 times as many jobs in this type of comparison (11,320 vs. 1,246).
How much broader is the general market for SAS compared to that focused on statistics? A direct job search for SAS for all uses yields 4.5 times as many jobs as a search that focuses on SAS for only statistical purposes (11,162 vs. 2,456). Interestingly, a similar comparison for SPSS results in only a 1.8-fold difference (3,231 vs. 1,808) while one for Stata is only 1.4 times higher (897 vs. 620). The ratios may reflect the breadth of use each package has in business reporting rather than statistical analysis.
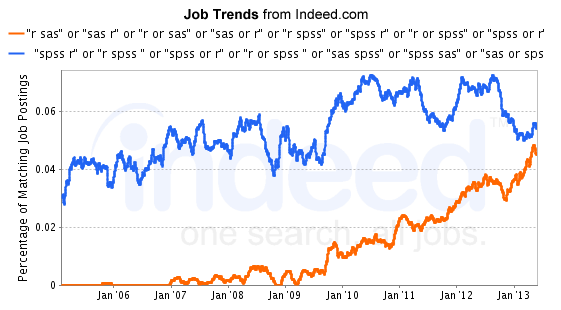
Comparing job openings of R to those for SPSS, both for statistical purposes, yields the plot in Figure 3.
We see that both SPSS and R show an overall upward trend, with R much steeper in the more recent years. The data for the most recent time period show that SPSS is still ahead, but not by a very wide margin.
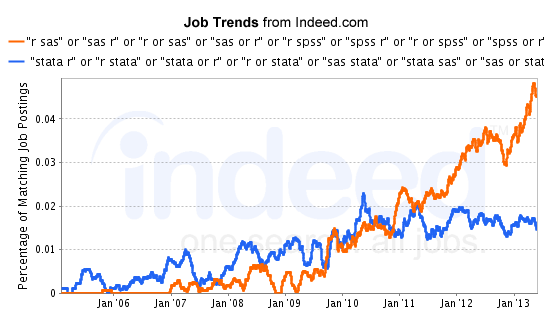
Next, let us examine the trend in jobs for R and Stata (Fig. 4).

Figure 4. Percentage of job postings across time for R and Stata, both used for statistical purposes.
We see that the jobs for Stata grew until mid-2010 where they have since been holding steady. Jobs for R have grown at much higher and steady rate since around January of 2009. In the most recent time period, there are roughly three times as many jobs for R as for Stata.
Given the power and ease of use of Indeed.com’s trend analyzer, I plan to switch the discussion over to it in future versions of The Popularity of Data Analysis Software. I’m very interested in hearing from people who can think of better ways to search for R using Indeed.com’s job trend tool.
If you would like to learn more about R or would like to learn more about Managing Data with R, you might consider registering for the upcoming webinar that I am presenting with the help of Revolution Analtyics.
(Note: All graphs and data were collected on August 5, 6, and 7, 2013)
R-bloggers.com offers daily e-mail updates about R news and tutorials about learning R and many other topics. Click here if you're looking to post or find an R/data-science job.
Want to share your content on R-bloggers? click here if you have a blog, or here if you don't.

