Plotting principal component analysis with ggplot #rstats
Want to share your content on R-bloggers? click here if you have a blog, or here if you don't.
This script was almost written on parallel to the sjPlotCorr script because it uses a very similar ggplot-base. However, there’s also a very nice posting over at Martin’s Bio Blog which show alternative approaches on plotting PCAs.
Anyway, if you download the sjPlotPCA.R script, you can easily plot a PCA with varimax rotation like this:
likert_4 <- data.frame(sample(1:4, 500, replace=T, prob=c(0.2,0.3,0.1,0.4)),
                       sample(1:4, 500, replace=T, prob=c(0.5,0.25,0.15,0.1)),
                       sample(1:4, 500, replace=T, prob=c(0.4,0.15,0.25,0.2)),
                       sample(1:4, 500, replace=T, prob=c(0.25,0.1,0.4,0.25)),
                       sample(1:4, 500, replace=T, prob=c(0.1,0.4,0.4,0.1)),
                       sample(1:4, 500, replace=T,),
                       sample(1:4, 500, replace=T, prob=c(0.35,0.25,0.15,0.25)))
colnames(likert_4) <- c("V1", "V2", "V3", "V4", "V5", "V6", "V7")
source("../lib/sjPlotPCA.R")
sjp.pca(likert_4)
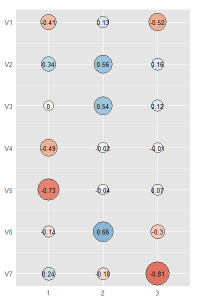
So, all you have to do is creating a data frame where each column represents one variable / case and pass this data frame to the function. This will result in something like this:

PCA of 7 variables resulting in 3 extracted factors (varimax rotation). Cronbach’s Alpha value of each “factor scale” printed at bottom.
The script automatically calculates the Cronbach’s Alpha value for each “factor scale”, assuming that the variables with the highest factor loading belongs to this factor. The amount of factors is calculated according to the Kaiser criterion. You can also create a plot of this calcuation by setting the parameter plotEigenvalues=TRUE.
The next small example shows two plots and uses a computed PCA as paramater:
pca <- prcomp(na.omit(likert_4), retx=TRUE, center=TRUE, scale.=TRUE)
sjp.pca(pca, plotEigenvalues=TRUE, type="circle")
Note that when using a PCA object as parameter and no data frame, the Cronbach’s Alpha value cannot be calculated.
That’s it! The source is available on my download page.
Tagged: Faktorenanalyse, ggplot, PCA, R, rstats
R-bloggers.com offers daily e-mail updates about R news and tutorials about learning R and many other topics. Click here if you're looking to post or find an R/data-science job.
Want to share your content on R-bloggers? click here if you have a blog, or here if you don't.


