Kalkalash! Pinpointing the Moments “The Simpsons” became less Cromulent
Want to share your content on R-bloggers? click here if you have a blog, or here if you don't.
Whenever somebody mentions “The Simpsons” it always stirs up feelings of nostalgia in me. The characters, uproarious gags, zingy one-liners, and edgy animation all contributed towards making, arguably, the greatest TV ever. However, it’s easy to forget that as a TV show “The Simpsons” is still ongoing—in its twenty-fourth season no less.
For me, and most others, the latter episodes bear little resemblance to older ones. The current incarnation of the show is stale, and has been for a long time. I haven’t watched a new episode in over ten years, and don’t intend to any time soon. When did this decline begin? Was it part of a slow secular trend, or was there a sudden drop in the quality, from which there was no recovery?
To answer these questions I use the Global Episode Opinion Survey (GEOS) episode ratings data, which are published online. A simple web scrape of the “all episodes” page provides me with 423 episode ratings, spanning from the first episode of season 1, to the third episode of season 20. After S20E03, the ratings become too sparse, which is probably a function of how bad the show, in its current condition, is. To detect changepoints in show ratings, I have used the R package changepoint. An informative introduction of both the package and changepoint analyses can be found in this accompanying vignette.
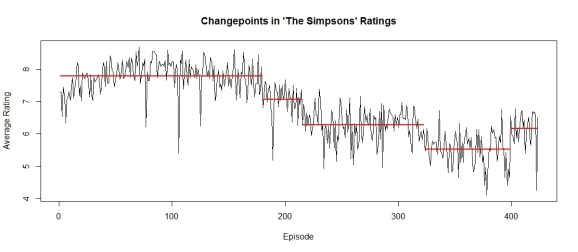
The figure above provides a summary of my results. Five breakpoints were detected. The first occurring in the first episode of the ninth season: The City of New York Vs. Homer Simpson. Most will remember this; Homer goes to New York to collect his clamped car and ends up going berserk. Good episode, although this essentially marked the beginning of the end.
According to the changepoint results, the decline occurred in three stages. The first lasted from the New York episode up until episode 11 in season 10. The shows in this stage have an average rating of about 7, and the episode where the breakpoint is detected is: Wild Barts Can’t Be Broken. The next stage roughly marks my transition, as it is about this point that I stopped watching. This stage lasts as far as S15E09, whereupon the show suffers the further ignominy of another ratings downgrade. Things possibly couldn’t get any worse, and they don’t, as the show earns a minor reprieve after the twentieth episode of season 18.
So now you know. R code for the analysis can be found in the below.
# packages
library(Hmisc) ; library(changepoint)
# clear ws
rm(list=ls())

# webscrape data
page1 = "http://www.geos.tv/index.php/list?sid=159&collection=all"
home1 = readLines(con<-url(page1)); close(con)

# pick out lines with ratings
means = '<td width="60px" align="right" nowrap>'
epis = home1[grep(means, home1)]
epis = epis[57:531]
epis = epis[49:474]

# prune data
loc = function(x) substring.location(x,"</span>")$first[1]
epis = data.frame(epis)
epis = cbind(epis,apply(epis, 1, loc))
epis$cut = NA
for(i in 1:dim(epis)[1]){
  epis[i,3] = substr(epis[i,1], epis[i,2]-4, epis[i,2]-1)
}
#create data frame
ts1 = data.frame(rate=epis$cut, episode=50:475)
# remove out of season shows and movie
ts1 = ts1[!(ts1$episode %in% c(178,450,451)),]
# make numeric
ts1$rate = as.numeric(as.character(ts1$rate))

# changepoint function
mean2.pelt = cpt.mean(ts1$rate,method='PELT')

# plot results
plot(mean2.pelt,type='l',cpt.col='red',xlab='Episode',
     ylab='Average Rating',cpt.width=2, main="Changepoints in 'The Simpsons' Ratings")

# what episodes ?
# The City of New York vs. Homer Simpson
# Wild Barts Can't Be Broken
# I, (Annoyed Grunt)-Bot -
# Stop Or My Dog Will Shoot!
R-bloggers.com offers daily e-mail updates about R news and tutorials about learning R and many other topics. Click here if you're looking to post or find an R/data-science job.
Want to share your content on R-bloggers? click here if you have a blog, or here if you don't.


