Vector fields with streamlines
Want to share your content on R-bloggers? click here if you have a blog, or here if you don't.
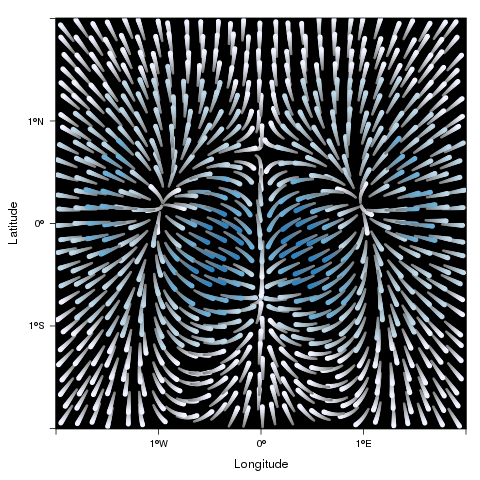
A new version of rasterVis is available at CRAN. This version includes several bug fixes and a new method to display vector fields with streamlines. Streamlines, a family of curves that are tangent to the vector field, show the direction an element (droplet) will follow under the effect of the field.
streamplot displays streamlines with a procedure inspired by the FROLIC algorithm: for each point (droplet) of a jittered regular grid, a short streamline portion (streamlet) is calculated by integrating the underlying vector field at that point. The main color of each streamlet indicates local vector magnitude (slope). Besides, streamlets are composed of points whose sizes, positions and color degradation encode the local vector direction (aspect).
proj <- CRS('+proj=longlat +datum=WGS84')
df <- expand.grid(x=seq(-2, 2, .01), y=seq(-2, 2, .01))

df$z <- with(df, (3*x^2 + y)*exp(-x^2-y^2))
r <- rasterFromXYZ(df, crs=proj)

streamplot(r)
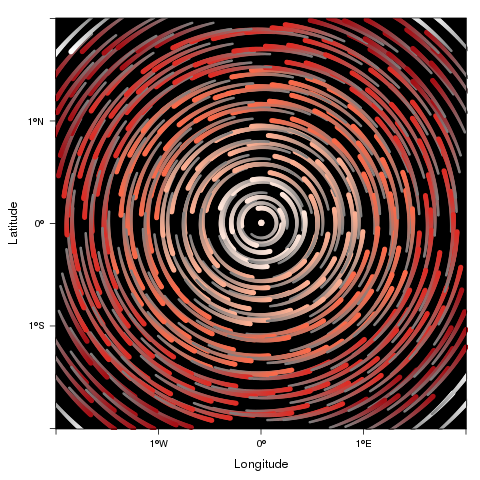
streamplot accepts two arguments (droplets and streamlets) to control the number of droplets, the length of the streamlets and the streamlet calculation step. The streamlet colour palette and the panel background color are defined with an specific theme for streamplot, streamTheme. The default options can be changed easily:
df$z <- with(df, sqrt(x^2 + y^2))
df$phi <- with(df, atan2(-y, x))
r2 <- rasterFromXYZ(df, crs=proj)

streamplot(r2, isField=TRUE, streamlet=list(L=30), droplet=list(pc=.3),
           par.settings=streamTheme(symbol=brewer.pal(n=5, name='Reds')))
R-bloggers.com offers daily e-mail updates about R news and tutorials about learning R and many other topics. Click here if you're looking to post or find an R/data-science job.
Want to share your content on R-bloggers? click here if you have a blog, or here if you don't.


