
Images as Voronoi tesselations
[This article was first published on is.R(), and kindly contributed to R-bloggers]. (You can report issue about the content on this page here)
Want to share your content on R-bloggers? click here if you have a blog, or here if you don't.
Want to share your content on R-bloggers? click here if you have a blog, or here if you don't.

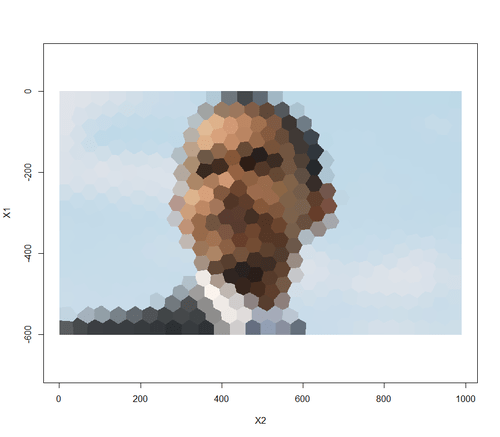
This is probably the coolest-looking thing I’ve figured out how to do with raster images in R. Similar to (although not quite as impressive as) these images by Jeff Clark, I alter the simple k-means approach described in the previous post to cluster primarily in Cartesian space, rather than in color space. This produces, essentially, Voronoi regions shaded with a region-average color, and the effect is really neat.
Note that increasing nRegions can produce drastically different results, but that kmeans() is quite slow as nRegions increases. Below, you’ll find a few examples, as well as the code. If you use this to make anything impressive, share it with us at @isDotR.


To leave a comment for the author, please follow the link and comment on their blog: is.R().
R-bloggers.com offers daily e-mail updates about R news and tutorials about learning R and many other topics. Click here if you're looking to post or find an R/data-science job.
Want to share your content on R-bloggers? click here if you have a blog, or here if you don't.