[This article was first published on is.R(), and kindly contributed to R-bloggers]. (You can report issue about the content on this page here)
Want to share your content on R-bloggers? click here if you have a blog, or here if you don't.
Want to share your content on R-bloggers? click here if you have a blog, or here if you don't.

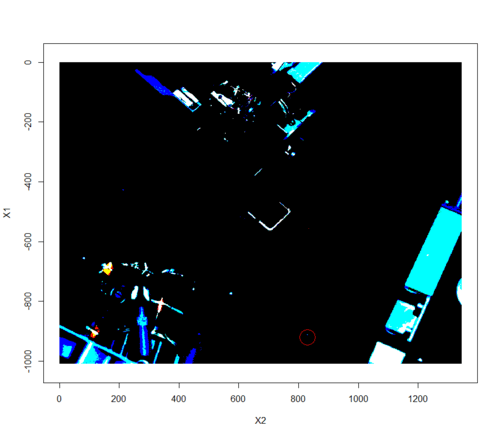
Finally, to return to the challenge I laid out in the first of this series on image manipulation in R: can we do anything as cool in R as can be done in Mathematica? Like, for example, this illustration of how to search images of the surface of Mars for bright anomalies?
The answer is “approximately.” Today’s Gist shows how to take the image above, roughly approximate the distribution of RGB values in a patch of sand, and filter the image to highlight only regions that are particularly unlikely to be sand. It’s not as impressive as the Mathematica example, but it’s not bad for a couple minutes’ work.

To leave a comment for the author, please follow the link and comment on their blog: is.R().
R-bloggers.com offers daily e-mail updates about R news and tutorials about learning R and many other topics. Click here if you're looking to post or find an R/data-science job.
Want to share your content on R-bloggers? click here if you have a blog, or here if you don't.
