Testing recommender systems in R
Want to share your content on R-bloggers? click here if you have a blog, or here if you don't.
Recommender systems are pervasive. You have encountered them while buying a book on barnesandnoble, renting a movie on Netflix, listening to music on Pandora, to finding the bar visit (FourSquare). Saar for Revolution Analytics, had demonstrated how to get started with some techniques for R here.
We will build some using Michael Hahsler’s excellent package – recommenderlab. But to build something we have to learn to recognize when it is good. For this reason we will talk about some metrics quickly –
– RMSE (Root Mean Squared Error) : Here we measure far were real ratings from the ones we predicted. Mathematically, we can write it out as
where is the set of all user-item pairings
for which we have a predicted rating
and a known rating
which was not used to learn the recommendation model.
Here at sane.a.lytics, I will talk about when an analysis makes sense and when it doesn’t. RMSE is a great metric if you are measuring how good your predicted ratings are. But if you want to know how many people clicked on your recommendation, I have a different metric for you.
– Precision/Recall/f-value/AUC: Precision tells us how good the predictions are. In other words, how many were a hit.
Recall tells us how many of the hits were accounted for, or the coverage of the desirable outcome.
Precision and recall usually have an inverse relationship. This becomes an even bigger issue for rare issue phenomenon like recommendations. To tackle this problem, we will use f-value. This is nothing but the harmonic mean of precision and recall.
Another popular measure is AUC. This is roughly analogous. We will go ahead and use this for now for our comparisons of recommendation effectiveness.
– ARHR (Hit Rate): Karypis likes this metric.
where is the position of the item in a ranked list.
OK, on to the fun stuff.
They are a few different ways to build a recommender system
Collaborative Filtering : If my friend Jimmy tells me that he liked the movie “Drive”, I might like it too since we have similar tastes. However if Paula tells me she liked “The Notebook”, I might avoid it. This is called UBCF (User-based collaborative filtering). Another way to think about it is that this is soft-clustering. We find Users with similar tastes (neighbourhood) and use their preferences to build yours.
Another flavour of this is IBCF (Item Based Collaborative Filtering). If I watched “Darjeeling Limited”, I might be inclined to watch “The Royal Tannenbaums” but not necessarily “Die Hard”. This is because the first two are more similar in the users who have watched/rated them. This is a rather simple to compute as all we need is the covariance between products to find out what this might be.
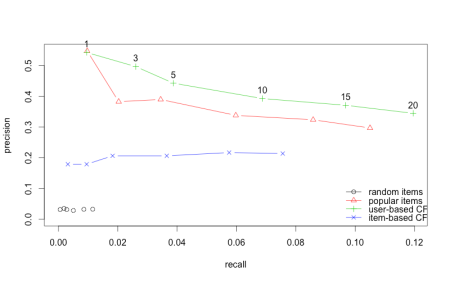
Let’s compare both approaches on some real data (thanks R)
It seems like UBCF did better than IBCF. Then why would you use IBCF? The answer lies is when and how are you generating recommendations. UBCF saves the whole matrix and then generates the recommendation at predict by finding the closest user. IBCF saves only k closest items in the matrix and doesn’t have to save everything. It is pre-calculated and predict simply reads off the closest items.
Predictably, RANDOM is the worst but perhaps surprisingly it seems, its hard to beat POPULAR. I guess we are not so different, you and I.
In the next post I will go over some other algorithms that are out there and how to use them in R. I would also recommend reading Michael’s documentation on recommenderlab for more details.
Also added this to r-bloggers. Please check it out for more R goodies.
R-bloggers.com offers daily e-mail updates about R news and tutorials about learning R and many other topics. Click here if you're looking to post or find an R/data-science job.
Want to share your content on R-bloggers? click here if you have a blog, or here if you don't.


