Want to share your content on R-bloggers? click here if you have a blog, or here if you don't.
Browsing commandlinefu.com today, I came across this little one-liner to display which commands I use most often.
$ history | awk '{a[$2]++}END{for(i in a){print a[i] " " i}}' \
| sort -rn | head
Here’s what I got:
283 ls
236 cd
52 cat
40 vim
36 sudo
27 ssh
27 rm
23 git
21 screen
21 R
Yep, seems legit. I navigate and look at files a whole bunch (ls, cd, cat), and I do a butt tonne of editing (vim). I sudo like a boss, hop onto various servers (ssh), clean up after myself (rm), commit commit commit (git), tuck away interactive sessions for later (screen), and of course, do mad stats (R).
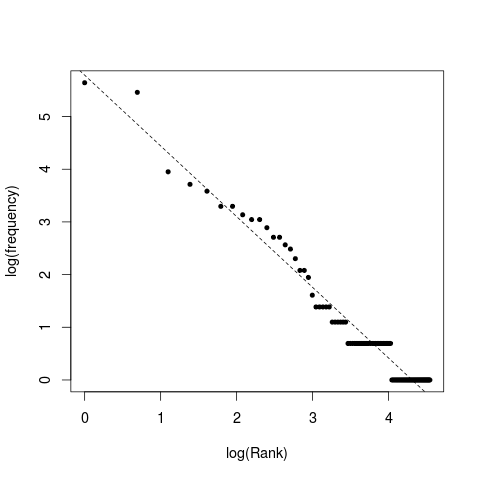
Now, my bash.rc set up is set to save the 1000 most recent commands. Given that it is Friday afternoon and I’m avoiding real work while waiting for the softball game to start, I thought I’d have a look at my whole usage distribution. So, lets just collect it up into a file comme ca:
$history | awk '{a[$2]++}END{for(i in a){print a[i] " " i}}' \
| sort -rn > cmd_hist.txt
Then crack open an R session and have a look:
Cool. Looks like my command usage pattern is roughly power-law distributed! Now, to . publish . my findings . in . Nature!
The R bits:
cmd<-read.table('cmd_hist.txt')
par(cex=1.2)
plot(log(1:length(cmd[,1])),log(cmd[,1]),
pch=20,
xlab='log(Rank)',
ylab='log(frequency)')
fit<-lm(log(cmd[,1])~log(1:length(cmd[,1])))
abline(fit,lty=2)

R-bloggers.com offers daily e-mail updates about R news and tutorials about learning R and many other topics. Click here if you're looking to post or find an R/data-science job.
Want to share your content on R-bloggers? click here if you have a blog, or here if you don't.

