What is the Potential Audience Size for a Hashtag Community?
Want to share your content on R-bloggers? click here if you have a blog, or here if you don't.
What’s the potential audience size around a Twitter hashtag?
Way back when, in the early days of webs stats, reported figures tended to centre around the notion of hits, the number of calls made to a server via website activity. I forget the details, but the metric was presumably generated from server logs. This measure was always totally unreliable, because in the course of serving a web page, a server might be hit multiple times, once for each separately delivered asset, such as images, javascript files, css files and so on. Hits soon gave way to the notion of Page Views, which more accurately measured the number of pages (rather than assets) served via a website. This was complemented with the notion of Visits and Unique Visits: Visits, as tracked by a cookies, represent a set of pages viewed around about the same time by the same person. Unique Visits (or “Uniques”), represent the number of different people who appear to have visited the site in any given period.
What we see here, then, is a steady evolution in the complexity of website metrics that reflects on the one hand dissatisfaction with one way of measuring or reporting activity, and on the other practical considerations with respect to instrumentation and the ability to capture certain metrics once they are conceived of.
Widespread social media monitoring/tracking is largely still in the realm of “hits” measurement. Personal dashboards for services such as Twitter typically display direct measures provided by the Twitter API, or measures trivially/directly identified from Twitter API or archived data – number of followers, numbers of friends, distribution of updates over time, number of mentions, and so on.
Something both myself and Martin Hawksey have both been thinking about on and off for some time are ways of reporting activity around Twitter hashtags. A commonly(?!) asked question in this respect relates to how much engagement (whatever that means) there has been with a particular tag. So here’s a quick mark in the sand about some of my current thinking about this. (Note that these ideas may well have been more formally developed in the academic literature – I’m a bit behind in my reading! If you know something that covers this in more detail, or that I should cite, please feel free to add a link in the comments… #lazyAcademic.)
One of the first metrics that comes to my mind is the number of people who have used a particular hashtag, and the number of their followers. Easily stated, it doesn’t take a lot of thought to realise even these “simple” measures are fraught with difficulty:
– what counts as a use of the hashtag? If I retweet a measure of yours that contains a hashtag, have I used it in any meaningful sense? Does a “use” mean the creation of a new tweet containing the tag? What about if I reply to a tweet from you than contains the tag and I include the tag in my reply to you, even if I’m not sure what that tag relates to?
– the potential audience size for the tag (potential uniques?), based on the number of followers of the tag users. At first glance, we might think this can be easily calculated by adding together the follower counts of the tag users, but this is more strictly an approximation of the potential audience: the set of followers of A may include some of the followers of B, or C; do we count the tag users themselves amongst the audience? If so, the upper bound also needs to take into account the fact that none of the users may be followers of any of the other tag users. (Note there is also a lower bound – the largest follower count amongst the tag users (whatever that means…) of the hashtag. Note that if we want to count the number of folk not using the tag but who may have seen the tag, this lower bound can be revised downwards by subtracting the number of tag users minus one (for the tag user with the largest follower count). The value is still only an approximation, though, becuase it assumes that all the tag users are actually included as followers of at least one, each, of the tag users. (If you think these points are “just academic”, they are and they aren’t – observations like these can often be used to help formulate gaming strategies around metrics based on these measures.)
– the potential number of views of a tag, for example based on the product of the number of times a user tweets and their follower count?
– the reach of (or active engagement with?) the tag, as measured by the number of people who actually see the tag, or the number of people who take and action around it (such as replying to a tagged tweet, RTing it, or clicking on a link a tagged tweet contains); note that we may be able ot construct probabilistic models of the potential r
To try to make this a little more concrete, here are a couple of scripts for exploring the potential audience size of a tag based on the followers of the tag users (where a user is someone who publishes or retweets a tweet containing the tag over a specified period). The first, Python script runs a Twitter search and generates a list of unique users of the tag, along with the timestamp of their first use of the tag within the sample period. This script also grabs all the followers of the tag users, along with their counts, and generates running cumulative (upper bound approximation) count of the tag user follower numbers as well as calculating the rolling set of unique followers to date as each new tag user is observed. The second, R script plots the values.
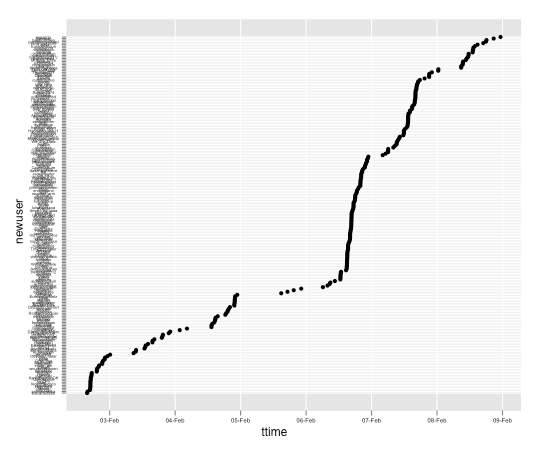
The first thing we can do is look at the incidence of new users of the hashtag over time:
(For a little more discussion of this sort of chart, see Visualising Activity Around a Twitter Hashtag or Search Term Using R.)
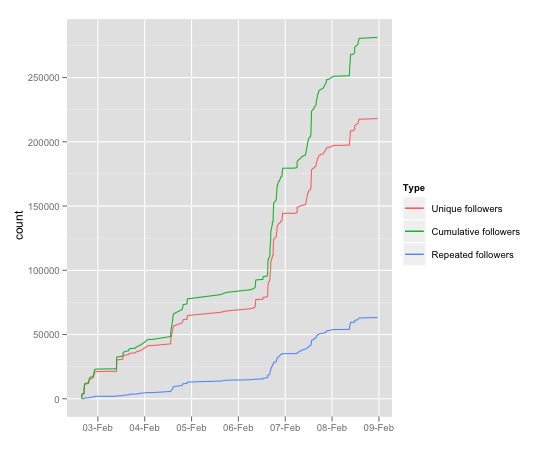
More relevant to this post, however, is a plot showing some counts relating to followers of users of the hashtag:
In this case, the top, green line represents the summed total number of followers for tag users as they enter the conversation. If every user had completely different followers, this might be meaningful, but where conversation takes place around a tag between folk who know each other, it’s highly likely that they have followers in common.
The middle, red line shows a count of the number of unique followers to date, based on the the followers of users of the tag to date.
The lower, blue line shows the difference between the red and green lines. This represents the error between the summed follower counts and the actual number of unique followers.
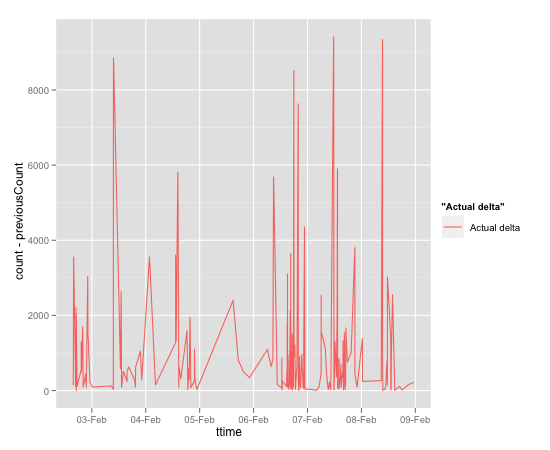
Here’s a view over the number of new unique potential audience members at each time step (I think the use of the line chart here may be a mistake… I think bars/lineranges would probably be more appropriate…):
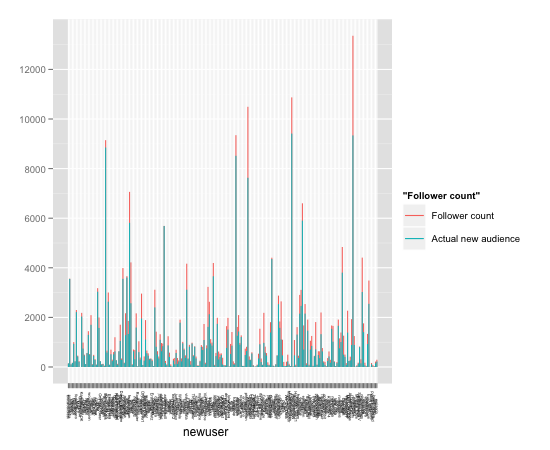
In the following chart, I overplot oneline with another. The lower layer (a red line) is the total follower account for each new tag user. The blue is the increase in the potential audience count (that is, the number of the new users’ followers that haven’t potentially seen the tag so far). The range of the visible part of the red line thus shows the number of a new tag user’s followers who have potentially already seen the tag. Err… maybe (that is, if my code is correct and all the scripts are doing what I think they’re doing! If they aren’t, then just treat this post as an exploration of the sorts of charts we might be able to produce to explore audience reach;-)
Here are the scripts (such as they are!)
import newt,csv,tweepy
import networkx as nx

#the term we're going to search for
tag='ddj'
#how many tweets to search for (max 1500)
num=500

##Something along lines of:
auth = tweepy.OAuthHandler(CONSUMER_KEY, CONSUMER_SECRET)
auth.set_access_token(SKEY, SSECRET)
api = tweepy.API(auth, cache=tweepy.FileCache('cache',cachetime), retry_errors=[500], retry_delay=5, retry_count=2)

#You need to do some work here to search the Twitter API
tweeters, tweets=yourSearchTwitterFunction(api,tag,num)
#tweeters is a list of folk who tweeted the term of interest
#tweets is a list of the Twitter tweet objects returned from the search
#My code for this is tightly bound up in a large and rambling library atm...

#Put tweets into chronological order
tweets.reverse()

#I was being lazy and wasn't sure what vars I needed or what I was trying to do when I started this!
#The whole thing really needs rewriting...
tweepFo={}
seenToDate=set([])
uniqSourceFo=[]
#runtot is crude and doesn't measure overlap
runtot=0
oldseentodate=0

#Construct a digraph from folk using the tag to their followers
DG=nx.DiGraph()

for tweet in tweets:
	user=tweet['from_user']
	if user not in tweepFo:
		tweepFo[user]=[]
		print "Getting follower data for", str(user), str(len(tweepFo)), 'of', str(len(tweeters))
		mi=tweepy.Cursor(api.followers_ids,id=user).items()
		userID=tweet['from_user_id'] #check
		DG.add_node(userID,label=user)
		for m in mi:
			tweepFo[user].append(m)
			#construct graph
			DG.add_edge(userID,m,weight=1)
			DG.node[m]['label']=''
		ufc=len(tweepFo[user])
		runtot=runtot+ufc
		#seen to date is all people who have seen so far, plus new ones, so it's the union
		oldseentodate=len(seenToDate)
		seenToDate=seenToDate.union(set(tweepFo[user]))
		uniqSourceFo.append((tweet['created_at'],len(seenToDate),user,runtot,ufc,oldseentodate))
	else:
		#I'm weighting the edges so we can count how many times folk see the hashtag
		if len(DG.edges(userID))>0:
			tmp1,tmp2=DG.edges(userID)[0]
			weight=DG[userID][tmp2]['weight']+1
			for fromN,toN in DG.edges(userID):
				DG[fromN][toN]['weight']=weight


fo='reports/tmp/'+tag+'_ncount.csv'
f=open(fo,'wb+')
writer=csv.writer(f)
writer.writerow(['datetime','count','newuser','crudetot','userFoCount','previousCount'])
for ts,l,u,ct,ufc,ols in uniqSourceFo:
	print ts,l
	writer.writerow([ts,l,u,ct,ufc,ols])

f.close()

print "Writing graph.."
filter=[]
for n in DG:
	if DG.degree(n)>1: filter.append(n)
filter=set(filter)
H=DG.subgraph(filter)
nx.write_graphml(H, 'reports/tmp/'+tag+'_ncount_2up.graphml')
print "Writing other graph.."
nx.write_graphml(DG, 'reports/tmp/'+tag+'_ncount.graphml')
Here’s the R script…
ddj_ncount <- read.csv("~/code/twapps/newt/reports/tmp/ddj_ncount.csv")
#Convert the datetime string to a time object
ddj_ncount$ttime=as.POSIXct(strptime(ddj_ncount$datetime, "%a, %d %b %Y %H:%M:%S"),tz='UTC')

#Order the newuser factor levels into the order in which they first use the tag
dda=subset(ddj_ncount,select=c('ttime','newuser'))
dda=arrange(dda,-desc(ttime))
ddj_ncount$newuser=factor(ddj_ncount$newuser, levels = dda$newuser)

#Plot when each user first used the tag against time
ggplot(ddj_ncount) + geom_point(aes(x=ttime,y=newuser)) + opts(axis.text.x=theme_text(size=6),axis.text.y=theme_text(size=4))

#Plot the cumulative and union flavours of increasing possible audience size, as well as the difference between them
ggplot(ddj_ncount) + geom_line(aes(x=ttime,y=count,col='Unique followers')) + geom_line(aes(x=ttime,y=crudetot,col='Cumulative followers')) + geom_line(aes(x=ttime,y=crudetot-count,col='Repeated followers')) + labs(colour='Type') + xlab(NULL)

#Number of new unique followers introduced at each time step
ggplot(ddj_ncount)+geom_line(aes(x=ttime,y=count-previousCount,col='Actual delta'))

#Try to get some idea of how many of the followers of a new user are actually new potential audience members
ggplot(ddj_ncount) + opts(axis.text.x=theme_text(angle=-90,size=4)) + geom_linerange(aes(x=newuser,ymin=0,ymax=userFoCount,col='Follower count')) + geom_linerange(aes(x=newuser,ymin=0,ymax=(count-previousCount),col='Actual new audience'))

#This is still a bit experimental
#I'm playing around trying to see what proportion or number of a users followers are new to, or subsumed by, the potential audience of the tag to date...
ggplot(ddj_ncount) + geom_linerange(aes(x=newuser,ymin=0,ymax=1-(count-previousCount)/userFoCount)) + opts(axis.text.x=theme_text(angle=-90,size=6)) + xlab(NULL)
In the next couple of posts in this series, I’ll start to describe how we can chart the potential increase in audience count as a delta for each new tagger, along with a couple of ways of trying to get some initial sort of sense out of the graph file, such as the distribution of the potential number of “views” of a tag across the unique potential audience members…
R-bloggers.com offers daily e-mail updates about R news and tutorials about learning R and many other topics. Click here if you're looking to post or find an R/data-science job.
Want to share your content on R-bloggers? click here if you have a blog, or here if you don't.


