Non overlapping labels on a ggplot scatterplot
[This article was first published on Drunks&Lampposts » R, and kindly contributed to R-bloggers]. (You can report issue about the content on this page here)
Want to share your content on R-bloggers? click here if you have a blog, or here if you don't.
Want to share your content on R-bloggers? click here if you have a blog, or here if you don't.
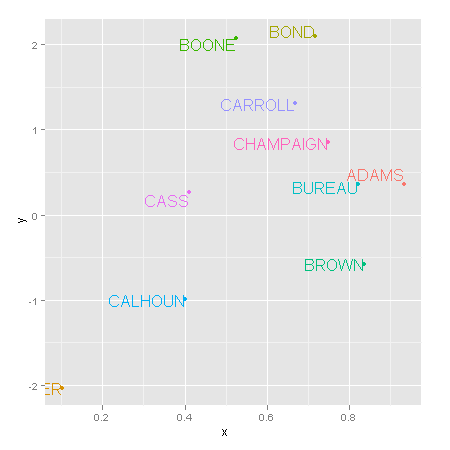
This is a very quick post just to share a quick tip on how to add non overlapping labels to a scatterplot in ggplot using a great package called directlabels. The trick is to make each point a single member group using an aesthetic like colour and then apply the direct.label function with the first.qp method. Some example code and output is below
library(ggplot2)
library(directlabels)
x<-runif(10)
y<-rnorm(10)
z<-as.character(midwest$county[1:10])
q<-qplot(x,y)+geom_point(aes(colour=z))
direct.label(q, first.qp)
If there are better ways then I’d love to know but it works well for me and has the added advantage that the labels are matched to the points by colour.
To leave a comment for the author, please follow the link and comment on their blog: Drunks&Lampposts » R.
R-bloggers.com offers daily e-mail updates about R news and tutorials about learning R and many other topics. Click here if you're looking to post or find an R/data-science job.
Want to share your content on R-bloggers? click here if you have a blog, or here if you don't.

