Want to share your content on R-bloggers? click here if you have a blog, or here if you don't.
Today is the World Tourism Day! So let’s speak about some tourism related datasets – and others.
Among other nice functions, Google offers a Public Data Explore in a beta version which provides a collection of datasets from OECD, IMF, Eurostat, World Bank, US Census Bureau, etc (cf. our datasets page as well). It is possible to plot these data directly online, with the following (limited) types: lines, barplots, maps and scatterplots.

The page reads “Data visualizations for a changing world“… nothing less! As someone writes on Andrew’s blog, it reminds a lot of Hans Rosling work with Gapminder‘s motion charts: “Unveiling the beauty of statistics for a fact based world view“.
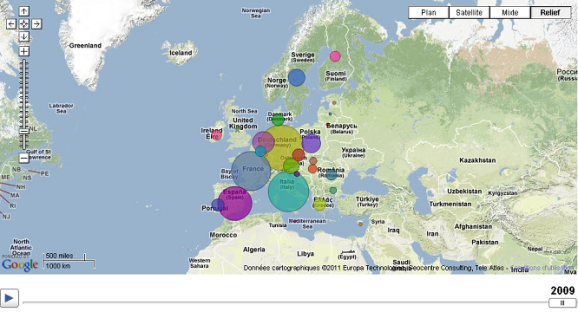
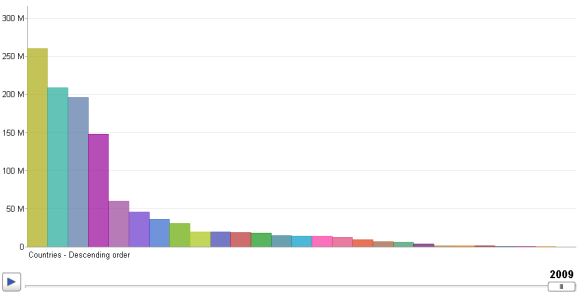
It is really easy to use, and a good opportunity for math highschool teachers to show nice graphs to students before they learn how to use R. The pointer to R is straightforward as it displays the same plots as the googleVis R package. For example for Tourism data, the number of nights spent in European countries looks like this in 2009 (click for getting the motion chart version!)
The barplot goes like this:

R-bloggers.com offers daily e-mail updates about R news and tutorials about learning R and many other topics. Click here if you're looking to post or find an R/data-science job.
Want to share your content on R-bloggers? click here if you have a blog, or here if you don't.


