2011 Perth City to Surf Stats
Want to share your content on R-bloggers? click here if you have a blog, or here if you don't.
Like every year, August sees the thousands taking part in the Perth City to Surf, and with that comes the chance for some stats. Why? Curiosity more than anything, and to convince myself that my time in the 12km run of 1 hour 9 mins and 36 seconds wasn’t so bad given I came down with the dreaded man flu just 36 hours prior to the race starting.
Despite the papers saying around 42,000 competed, the official results site lists results for 32,243 (excluding <10 people listed as NA for age and sex). 15,424 males (45.1%) and 18,791 females (54.9%)*.
Individual results are available at Perth Now.
| Female | Male | Total | |
|---|---|---|---|
| 4km Walk | 3118 (65.6%) | 1638 (34.4%) | 4756 |
| 4km Run | 1904 (55.9%) | 1503 (44.1%) | 3407 |
| 12km Walk | 6058 (74.4%) | 2087 (25.6%) | 8145 |
| 12km Run | 6507 (45.5%) | 7805 (54.5%) | 14312 |
| Half Marathon | 1005 (36.8%) | 1728 (63.2%) | 2733 |
| Marathon | 199 (23.1%) | 663 (76.9%) | 862 |
Next of interest is the finishing times. Here we have both the median and mean for each sex for each event. Means are 2.5% trimmed, which means the fastest and slowest 2.5% of people were removed before calculating the mean, due to the mean being heavily influenced by outliers.
| Female | Male | Total | |
|---|---|---|---|
| 4km Walk | 47 : 46.6 | 47 : 46.4 | 46.8 : 46.5 |
| 4km Run | 29 : 30.6 | 27 : 28.6 | 28.4 : 29.7 |
| 12km Walk | 125 : 124.9 | 122 : 122.1 | 124.4 : 124.2 |
| 12km Run | 80 : 82.8 | 68 : 70.5 | 73.7 : 76.1 |
| Half Marathon | 125 : 126.2 | 111 : 113.1 | 116.3 : 117.9 |
| Marathon | 251 : 251.7 | 232 : 237.8 | 237.2 : 241 |
format being “Median : Mean (trimmed)”
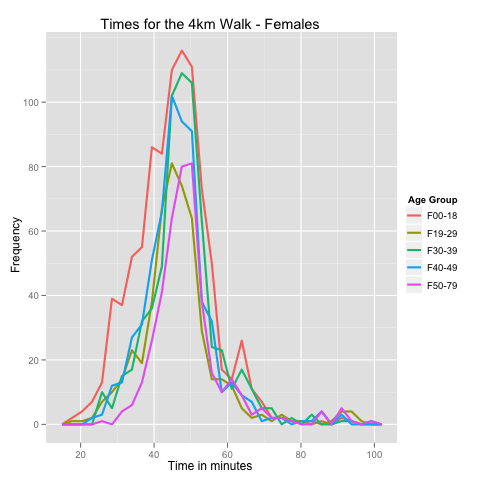
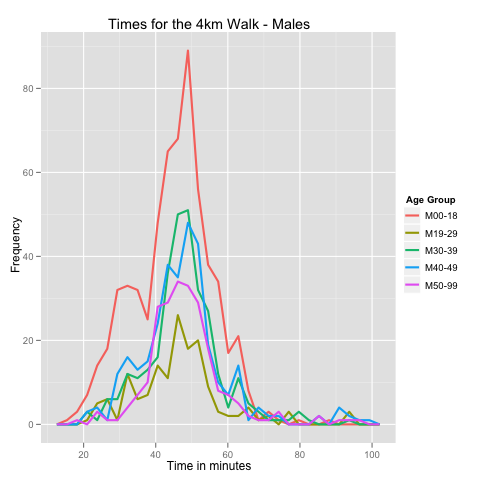
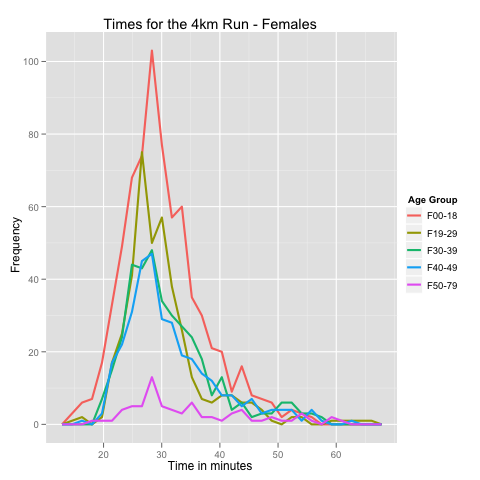
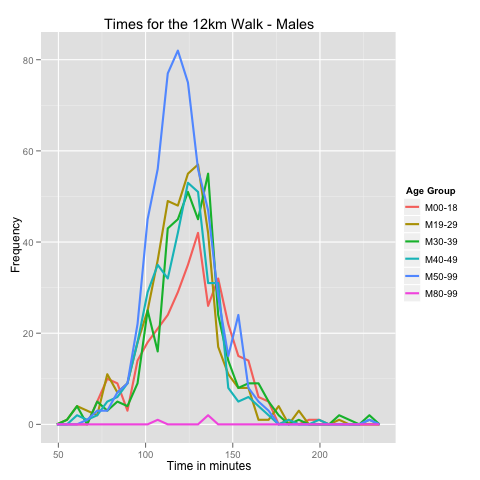
From here you might be interested in how you stacked up against your peers by age. Below is a series of graphs and small tables for each sex for each event. These graphs are called frequency polygons, they’re nothing to be afraid of, they are essentially histograms but with lines rather than bars. This way we can see multiple groups plotted on the same axis with hopefully less clutter. For some of these graphs I can cut off at arbitrary upper limits to remove a few… ‘stragglers’.
4km Walk
For the females:
| Age | People | Median : Mean (trimmed) |
|---|---|---|
| 0-18 | 926 | 45.6 : 45.2 |
| 19-29 | 497 | 45.6 : 46 |
| 30-39 | 652 | 47.9 : 47.9 |
| 40-49 | 615 | 46.2 : 46.3 |
| 50-79 | 428 | 48.3 : 49 |
| Total | 3118 | 46.7 : 46.6 |
For the Males:
| Age | People | Median : Mean (trimmed) |
|---|---|---|
| 0-18 | 620 | 46.1 : 45 |
| 19-29 | 157 | 46.7 : 46.3 |
| 30-39 | 308 | 47.5 : 47.5 |
| 40-49 | 322 | 47.5 : 47.4 |
| 50-99 | 231 | 47.3 : 48.1 |
| Total | 1638 | 47 : 46.4 |
Not a lot of variation here, as expected though with this event. Twice as many females in this than males and a similar spread across the ages for each sex. Good to see in the young group, especially with the males, there’s a small group that ran ahead (see the first peak for the pink line in the male graph).
4km Run
For the females:
| Age | People | Median : Mean (trimmed) |
|---|---|---|
| 0-18 | 718 | 29.1 : 30.2 |
| 19-29 | 402 | 28.8 : 29.7 |
| 30-39 | 374 | 29.5 : 31.1 |
| 40-49 | 337 | 29.6 : 31.2 |
| 50-79 | 73 | 31.2 : 34.8 |
| Total | 1904 | 29.2 : 30.6 |
For the males:
| Age | People | Median : Mean (trimmed) |
|---|---|---|
| 0-18 | 643 | 26.2 : 27.4 |
| 19-29 | 196 | 25.4 : 26.9 |
| 30-39 | 235 | 29.4 : 31.3 |
| 40-49 | 321 | 27.4 : 29.1 |
| 50-79 | 108 | 28.5 : 32.1 |
| Total | 1503 | 27.1 : 28.6 |
Here we see a bit more variation, but times are still very close across age groups. Little variation within the females between the 30-39 and 40-49 group, and in the males the 40-49 group sitting slightly faster than the 30-39 group. I personally wouldn’t read too much into this given the nature of the 4km events, having large numbers does make this representative though of what is going on. Given the skewed distribution (tail to the right) the medians might tell a better story here as being more representative where the peak lies.
12km Walk
For the females:
| Age | People | Median : Mean (trimmed) |
|---|---|---|
| 0-18 | 676 | 126.8 : 126.8 |
| 19-29 | 1952 | 123.9 : 123.5 |
| 30-39 | 1234 | 125.6 : 125 |
| 40-49 | 1170 | 124.5 : 124.8 |
| 50-79 | 1026 | 126 : 126.6 |
| Total | 6058 | 125.1 : 124.9 |
For the males:
| Age | People | Median : Mean (trimmed) |
|---|---|---|
| 0-18 | 333 | 126.7 : 125.2 |
| 19-29 | 421 | 121 : 119.7 |
| 30-39 | 388 | 124.5 : 125.1 |
| 40-49 | 375 | 122 : 120.7 |
| 50-99 | 567 | 119.6 : 120.8 |
| Total | 2087 | 122.2 : 122.1 |
Again with the walkers, as you would expect, this is very tight. Another event dominated by the females, not much more to say other than looks good they all walked together.
12 km run
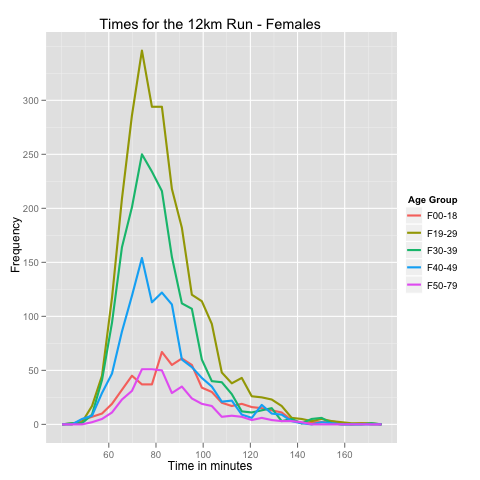
For the females:
| Age | People | Median : Mean (trimmed) |
|---|---|---|
| 0-18 | 618 | 88.3 : 90.3 |
| 19-29 | 2585 | 80 : 82.4 |
| 30-39 | 1825 | 78.8 : 80.8 |
| 40-49 | 1087 | 79.6 : 81.9 |
| 50-79 | 392 | 81.8 : 85 |
| Total | 6507 | 80.5 : 82.8 |
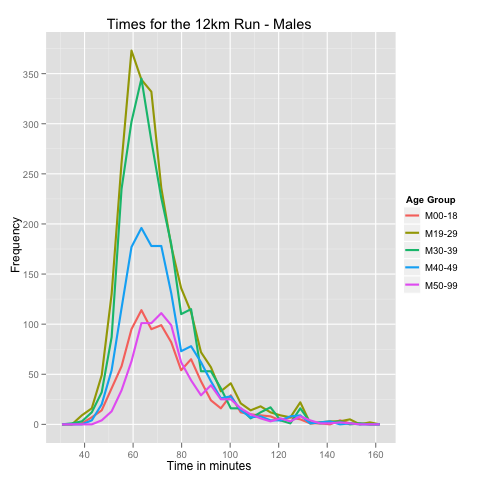
For the males:
| Age | People | Median : Mean (trimmed) |
|---|---|---|
| 0-18 | 895 | 70.2 : 73.2 |
| 19-29 | 2501 | 66.2 : 69 |
| 30-39 | 2171 | 66.4 : 68.8 |
| 40-49 | 1426 | 68.6 : 71 |
| 50-99 | 812 | 72.7 : 75.6 |
| Total | 7805 | 67.8 : 70.5 |
This was the big event. And I was really surprised, and impressed, to see that there was little variation with age. The 19-29 and 30-39 groups for the guys pulled up slightly faster, the 40-49 for the females held their own as well. I really expected to see more of a staggering to the right with increasing age.
Half Marathon
For the females:
| Age | People | Median : Mean (trimmed) |
|---|---|---|
| 0-24 | 139 | 120.7 : 124.6 |
| 25-34 | 434 | 123.3 : 124.6 |
| 35-44 | 285 | 126.8 : 127.5 |
| 45-54 | 126 | 128.4 : 129.2 |
| 55-99 | 21 | 133.4 : 138.9 |
| Total | 1005 | 125.2 : 126.2 |
For the males:
| Age | People | Median : Mean (trimmed) |
|---|---|---|
| 0-24 | 217 | 109.3 : 111.1 |
| 25-34 | 633 | 108.5 : 111.2 |
| 35-44 | 533 | 112.4 : 113.2 |
| 45-54 | 258 | 113.4 : 115.6 |
| 55-99 | 87 | 126 : 125.2 |
| Total | 1728 | 111.1 : 113.1 |
These graphs are a little more jagged due to the slightly lower numbers and wider spread of times. Again very consistent. The females have less of a sharp peak, suggesting they didn’t run in together in a big group like the males.
Marathon
Everyone
For the females:
| Age | People | Median : Mean (trimmed) |
|---|---|---|
| 0-24 | 19 | 254.9 : 255.4 |
| 25-34 | 83 | 243.2 : 248.8 |
| 35-44 | 54 | 244.1 : 243.1 |
| 45-99 | 43 | 259.1 : 266.7 |
| Total | 199 | 251.1 : 251.7 |
For the males:
| Age | People | Median : Mean (trimmed) |
|---|---|---|
| 0-24 | 72 | 229.4 : 236.3 |
| 25-34 | 206 | 230.6 : 237 |
| 35-44 | 210 | 228.2 : 234.5 |
| 45-99 | 175 | 239.9 : 243.8 |
| Total | 663 | 231.6 : 237.8 |
On average the guys ran in 20 minutes ahead of the gals. For context 4 hours is 240 minutes, so the males were 10 minutes faster than that and the females 10 minutes slower, on average.
Other stats
Anything else you’d like to see, statistic wise or graphed just let me know in a comment below. Or if you, heaven forbid, spot an error.
Thanks to all those who participated, see you again next year!
Geek speak
These statistics and graphs were produced in R, graphs using the ggplot2 package using geom_frequency. The code used for this is available here. It’s not pretty by any means. The data was manually scrapped from the results site given it loads in separate pages for each sex/age group.
* 28 wheel chair participants excluded as I couldn’t easily get their data from the site.
R-bloggers.com offers daily e-mail updates about R news and tutorials about learning R and many other topics. Click here if you're looking to post or find an R/data-science job.
Want to share your content on R-bloggers? click here if you have a blog, or here if you don't.

