Analysis of ISMB coverage at FriendFeed: 2008 – 2011
Want to share your content on R-bloggers? click here if you have a blog, or here if you don't.
ISMB/ECCB 2011 was held between July 15-19 this year and as in previous years, FriendFeed was used to cover the meeting.
Last year, I wrote a post about how to use R to analyse the coverage. I was planning something similar for 2011 when I thought: we have 4 years of ISMB at FriendFeed now – why not look at all of them?
So I did. Read on for the details.
|
1. First – an apology In my post from last year, I included some R code which will grab a FriendFeed feed in JSON format using the API and convert it to an R list. I would have used it again this year, except that the ISMB 2008 feed is no longer a complete archive of the 2008 meeting. This is, unfortunately, my fault – but all is not lost. I decided to leave FriendFeed earlier this year and began by deleting the services from which my feed imported items. This failed to have the desired effect: items were still imported, other users commented on them. I decided, impulsively, that the only solution was to delete my account. Of course, this resulted in deletion of everything that I’d ever posted, including my contributions to the ISMB 2008 feed. For some reason, it had not occurred to me that my contributions were useful for a lot of other people. What can I say – it was one of those rash, snap decisions and I apologise for the inconvenience caused. However, as I said, all was not lost. Before leaving, I backed up the ISMB 2008 feed (and a few other key feeds) to a MongoDB database. So a complete archive still exists on the Web; see the next section for the details. |
||||||||||||||||||||||||||||||||||
|
2. Code and data at GitHub Rather than paste lots of code snippets here, I’ve created a GitHub repository for the project. You’ll find 3 sub-directories: code, with a Ruby script for archiving FriendFeed feeds to MongoDB and R code, for retrieving from the database as an R list; data, with the ISMB 2008 feed exported in JSON format and all meetings saved as .RData files; and docs, containing a Sweave script to generate a report, along with the associated PDF files. |
||||||||||||||||||||||||||||||||||
|
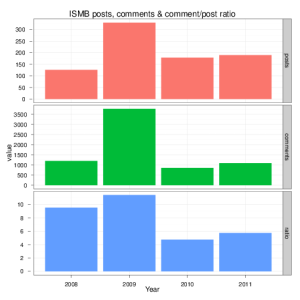
3. Posts, comments, comment/post ratio So let’s get into it. First, how many posts and comments for each meeting? Most posts are the titles of a talk, on which participants can then comment. From 2009 onwards, the ISMB committee posted each title just before the presentation took place; prior to that, titles were posted by the bloggers themselves. We can see the increase in talks at the joint ISMB/ECCB meetings in 2009 and 2011. Most comments were posted at the 2009 meeting. This was due to two factors: promotion of the FriendFeed site by ISMB, based on the success of the 2008 experiment and the attendance of several enthusiastic, prolific participants in 2009. Yes you, Allyson “the robo-blogger” Lister and Ruchira Datta. Since then, total comments have fallen to below those in 2008. The comment/post ratio is a crude measure of how much discussion is generated by posts. It was relatively high in 2008, peaked in 2009 and since then, has declined. One reason for this is that whilst all talks are posted by ISMB, many are not attended by the bloggers involved. |
||||||||||||||||||||||||||||||||||
|
4. Commenters Here’s a look at how many individuals participated (posted at least one comment) each year. This ranges from 33 people in 2008, to a high of 63 in 2009 and a low of 18 this year. Again, the heavy promotion of the FriendFeed site in 2009 may be a factor. 110 unique individuals have posted 6 906 comments at ISMB between 2008 and 2011. |
||||||||||||||||||||||||||||||||||
|
5. Posts with/without comments This stacked chart shows the proportion of posts with/without comments each year. The proportion of posts with comments has declined steadily, from around 90% in 2008 to about 26% in 2011. That can be explained in part by the observation that in 2008, posts were initiated by the bloggers themselves. This means that at least one blogger was in the room waiting for the talk to begin and therefore, comments on a post were more likely. In later years, where all talks are posted by default, there are in effect “fewer bloggers to go around.” |
||||||||||||||||||||||||||||||||||
|
6. Comments per post This chart shows the range of comments per post. We can see that each year has many outliers – posts which are far more popular than most other posts. These are often, but not exclusively, the keynote presentations. The median number of comments on a post has fallen from 6.5 in 2008, to 5 in 2009, to zero in 2010 and 2011. This simply means that at least half of the posts did not receive a comment, for the reasons described in the previous section. |
||||||||||||||||||||||||||||||||||
|
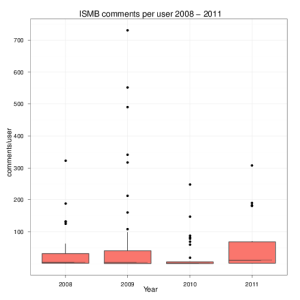
7. Comments per user We can also look at comments per user, which gives some idea of participant activity: is it spread between bloggers or are there several key people doing most of the blogging? The interesting observation here is that more participants leads to fewer comments per person. Total participants:median comments per person for each year are as follows: 2008 33:5, 2009 63:4.5, 2010 33:2, 2011 18:11. This suggests two scenarios: either a “long tail”, where many people post a few comments and a few people post many comments, or a smaller, core group with a more even spread of activity. |
||||||||||||||||||||||||||||||||||
|
8. Comments per user: distribution Some insight into user activity is gained by plotting the distribution of comments per user as a density plot (think of it as a smoothed histogram). Unfortunately, the scale here does not show all of the peaks very well (it looks better in the original X11 window). However, 2011 is clearly different to other years with far fewer participants and 3 distinct groups of low, medium and high activity. |
||||||||||||||||||||||||||||||||||
|
9. Comments timeline I must confess that I’m rather pleased with this plot. It shows hourly comment activity for each day of the conference and each year (6 days in 2009, 5 days in the other years). Typically, ISMB consists of satellite meetings for the first 2 days, followed by the main event on days 3-5. If you squint, you can discern peaks of activity corresponding to the morning and afternoon keynote presentations. The overall higher activity in 2009 is apparent. You can also see that in 2011, coverage of the earlier SIG meetings started strongly, but stalled on day 2. I believe, as is often the case, that this was due to wi-fi issues, which also plagued the 2010 meeting. Times on FriendFeed are recorded in GMT. This allows us to distinguish the North American meetings (2008, 2010) where talks appear to take place in the evening from those in Europe (2009, 2011), where the times are more as you might expect. A nice modification to the code would be conversion of dates/times to the local timezone for the meeting. |
||||||||||||||||||||||||||||||||||
|
10. Top 10 posts 2008 – 2011 The 10 most popular talks, as judged by number of comments, from the last 4 years?
Keynotes are always popular of course, but it’s good to see some of the other sessions make the top 10 list. In particular, a SIG presentation on SNPs ranks second, highlighting the interest in this topic. Of course, there are popular talks that lie just outside the top 10 and a few talks, such as Janet Thornton’s 2011 keynote, which rank highly in terms of “likes” but have fewer comments. Presumably, the audience are too engrossed to be distracted by blogging. |
||||||||||||||||||||||||||||||||||
Summary
I think microblogging at ISMB is still quite strong, despite the recent decline in participants. It’s still too early to discern patterns, if indeed there are any. Each meeting has its own unique character in terms of attendance, topics and importantly, wi-fi reliability.
One observation is that when the organizers post every talk title, only a small proportion of posts receive comments. Is it better for the participants to post only material that interests them? Should ISMB try harder to get a blogger at every session? Or is the current system just fine and a reflection of the topics that people find most interesting? These are questions for the ISMB blogging committee.
ISMB 2012 will take place in Long Beach, California (sounds tempting!) from July 13-17. Will FriendFeed still be running? Will a different service take over? We’ll wait and see but hopefully, whatever the medium, there’ll be messages for many years to come.
Filed under: bioinformatics, meetings, programming, R, ruby, statistics Tagged: friendfeed, ismb
R-bloggers.com offers daily e-mail updates about R news and tutorials about learning R and many other topics. Click here if you're looking to post or find an R/data-science job.
Want to share your content on R-bloggers? click here if you have a blog, or here if you don't.


