Want to share your content on R-bloggers? click here if you have a blog, or here if you don't.

MARCH 16 UPDATE: My email scraping has become surprisingly controversial, so I’ve taken down the code and other plots for now. Ironically, I’ve also updated the plot.
I studied the emails sent to my dorm’s email list and drew some plots. A little context should be enough for you to follow them.
Risley Hall is an arts-themed dorm at Cornell University for undergraduates of all years. Everyone who lives in the dorm is on the risleyhall-l mailing list. Until recently, anyone was allowed to send emails to that. Last fall, the powers that were decided to turn risleyhall-l into a moderated announcements list and to create an open discussion list called squidserve-l, named after the Risley mascot.
I used Thunderbird to save the emails in plain text and then used grep, sed and R to extract and plot information. The source code is here. Or clone the git repository.
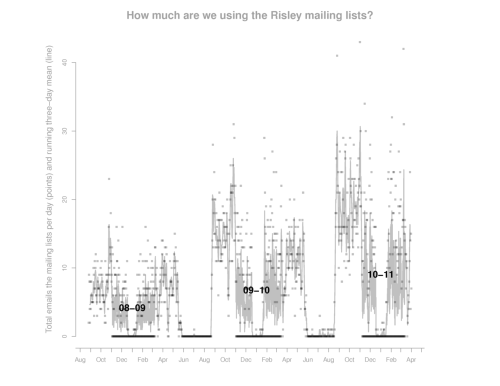
The graph above shows daily activity over time. Activity has generally been increasing over the past three years. The highest-activity days were November 1, 2010, with 43 emails and March 9, 2011, with 42 emails, both of which were days when nonsensical mailing list policy was being discussed heavily on the mailing lists.
There are some consistent within-year activity patterns. Peaks of activity occur at the beginning of the year and at the end of October. Also, activity is lower from November to March, and there’s hardly any activity over breaks.
I’ll probably continue doodling this for a while as a break from less frivolous activities. I’ve just started charting the occurrence of different words (regular expressions actually) in emails. Check back in a couple weeks and see what else I come up with.
R-bloggers.com offers daily e-mail updates about R news and tutorials about learning R and many other topics. Click here if you're looking to post or find an R/data-science job.
Want to share your content on R-bloggers? click here if you have a blog, or here if you don't.
