Want to share your content on R-bloggers? click here if you have a blog, or here if you don't.
The R Function of the Day series will focus on describing in plain language how certain R functions work, focusing on simple examples that you can apply to gain insight into your own data.
Today, I will discuss the foodweb function, found in the mvbutils package.
Foodweb? What is that?
In biology, a foodweb is a group of food chains, showing the complex relationships that exist in nature. Similarly, the R foodweb function contained in the mvbutils package on CRAN displays a flowchart of function calls. What functions does my function call? What funtions in my package call the lm function? These are the types of questions that can be answered in a graphical way using foodweb. This information can be useful for documenting your own code, and for learning how a package that you’re not familiar with works. At the end of this post, you’ll see an example with a diagram of the survexp function from the survival package.
First, you have to install and load the mvbutils package, so let’s do that first.
install.packages("mvbutils")
library(mvbutils)
A simple example
Let’s define a couple simple functions to see how foodweb works. We simply define a function called outer that calls two functions, inner1 and inner2.
inner1 <- function() {
  "This is the inner1 function"
}

inner2 <- function() {
  "This is the inner2 function"
}

outer <- function(x) {
   i1 <- inner1()
   i2 <- inner2()
}
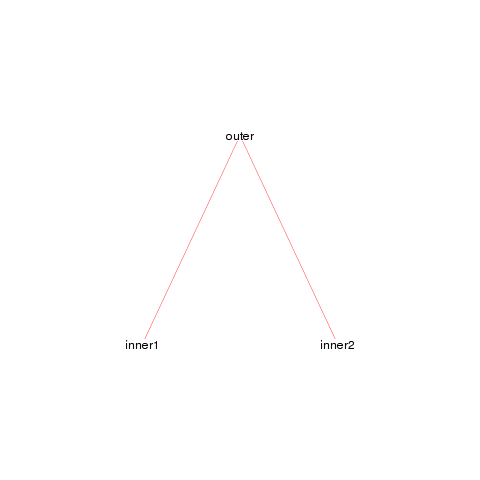
Now let’s use the foodweb function to diagram the relationship between the outer and inner functions. If we don’t give foodweb any arguments, it will scour our global workspace for functions, and make the diagram. Since the only functions in my global workspace are the ones we’ve just defined, we get the following plot.
foodweb()

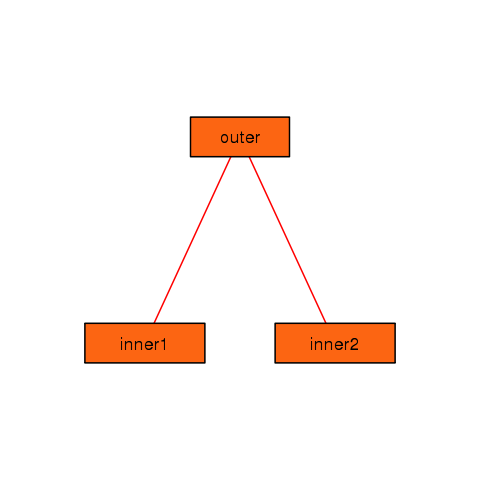
We see a simple graph showing that the outer function calls both the inner1 and inner2 functions, jus as we expect. We can make this look a bit nicer by adjusting a few of the arguments.
foodweb(border = TRUE, expand.xbox = 3,
        boxcolor = "#FC6512", textcolor = "black",
        cex = 1.2, lwd=2)

You can see that you can control many of the graphical parameters of the resulting plot. See the help page for foodweb to see the complete list of graphical parameters you can specify.
A more complicated example
As we saw above, by default foodweb will look in your global workspace for functions to construct the web from. However, you can pass foodweb a group of functions to operate on. There are several ways of doing this, see the help page for examples. The code below shows one possiblity, when we want to limit our results to functions appearing in a specific package. The prune argument is very useful. It takes a string (or regular expression) to prune the resulting graph to.
foodweb(where = "package:survival", prune = "survexp",
        border = TRUE,
        expand.xbox = 2, boxcolor = "#FC6512",
        textcolor = "black", cex = 1.0, lwd=2)
mtext("The survexp function foodweb")
Conclusion
I have used the foodweb function to help understand other user’s code that I have inherited. It has proved very valuable in aiding the comprehension of hard to read or complicated functions. I have also used it in the development of my own packages, as it sometimes can suggest ways to reorganize the code to be more logical.
Tags:
R-bloggers.com offers daily e-mail updates about R news and tutorials about learning R and many other topics. Click here if you're looking to post or find an R/data-science job.
Want to share your content on R-bloggers? click here if you have a blog, or here if you don't.
