[This article was first published on R-Chart, and kindly contributed to R-bloggers]. (You can report issue about the content on this page here)
Want to share your content on R-bloggers? click here if you have a blog, or here if you don't.
Want to share your content on R-bloggers? click here if you have a blog, or here if you don't.

The simplest versions of plots use color rather sparingly. For instance, consider this simple bar chart:
n=seq(1:12)
barplot(n)
Not exactly the most colorful thing you’ve ever seen eh?
R provides standard color palettes comprised of vectors containing a series of contiguous colors.
It is simple to view color wheels based upon default color palettes using pie charts.
Determine how many different colors you need and set a variable to this number. Then create a pie chart to see what the shape of our color wheel will be.
n=12
pie(rep(1,n), col=FALSE)
Now try some of the built in palettes and evaluate the results.
pie(rep(1,n), col=rainbow(n))

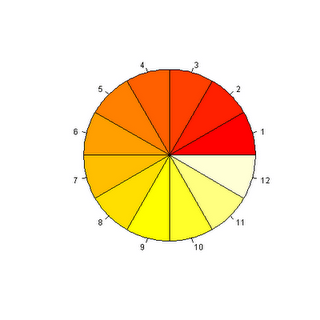
If you would prefer something skewed to the reds and yellows, use heat.
pie(rep(1,n), col=heat.colors(n))
If you prefer something in earth tones, use terrain.
pie(rep(1,n), col=terrain.colors(n))
If you prefer these this type of palette, but with a bit more blue, try topo.
pie(rep(1,n), col=topo.colors(n))
Finally, if you prefer subdued pinks and blues, try cm.
pie(rep(1,n), col=cm.colors(n))
So returning to our original bland example we instead specify a color palette.
barplot(seq(1:12), col=topo.colors(12))
These are a few quick examples that demonstrate how to quickly to add color in a reasonably aesthetically pleasing way. To get more information on palettes in R:
?rainbow
This really only scratches the surface on the use of color in R. There are many different considerations on the use of color that are dependent on the device or medium involved, person viewing the image, the type of visualization etc. The best single presentation I have seen on the use of color in R is by Earl F. Glynn at the Stowers Institute for Medical Research. His presentation is available in pdf. He goes into much more depth about how color is represented and manipulated in R. He discusses what objects can be colored, referencing colors by name, gradients, color blindness, and differences in color presentation in different devices. To get an idea of some of the ways color is referenced that are explained in the presentation enter the following help command.
help(package=colorspace)
In case you think all this color stuff should be left to the artists and designers, he provides a link to an article at IBM that argues effectively to the contrary.
If you want even more information about how the eye perceives color and how color effectively encode information in visualizations, Hanspeter Pfister at Harvard teaches a course on the subject. Videos of the 2008 version of the course are available on iTunes.
To leave a comment for the author, please follow the link and comment on their blog: R-Chart.
R-bloggers.com offers daily e-mail updates about R news and tutorials about learning R and many other topics. Click here if you're looking to post or find an R/data-science job.
Want to share your content on R-bloggers? click here if you have a blog, or here if you don't.


