
ggplot2: Crayola Crayon Colours
Want to share your content on R-bloggers? click here if you have a blog, or here if you don't.
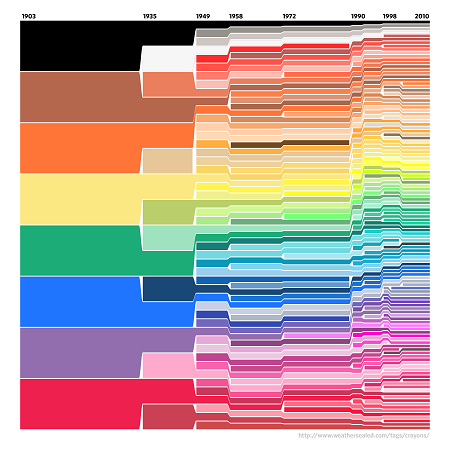
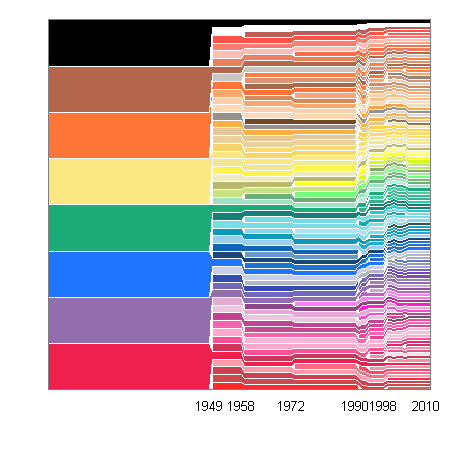
Statistical Algorithms blog attempted to recreate a graph depicting the growing colour selection of Crayola crayons in ggplot2 (original graph below via FlowingData).
He also asked the following questions: Is there an easier way to do this? How can I make the axes more like the original? What about the white lines between boxes and the gradual change between years? The sort order is also different.
I will present my version in this post, trying to address some of these questions.
Data Import
The list of Crayola crayon colours is available on Wikipedia, and also contains one duplicate colour (#FF1DCE) that was excluded to make further processing easier.
> library(XML) > library(ggplot2) |
> theurl <- "http://en.wikipedia.org/wiki/List_of_Crayola_crayon_colors"
> html <- htmlParse(theurl)
> crayola <- readHTMLTable(html, stringsAsFactors = FALSE)[[2]]
> crayola <- crayola[, c("Hex Code", "Issued", "Retired")]
> names(crayola) <- c("colour", "issued", "retired")
> crayola <- crayola[!duplicated(crayola$colour),
+     ]
> crayola$retired[crayola$retired == ""] <- 2010
|
Plotting
Instead of geom_rect() I will show two options of plotting the same data using geom_bar() and geom_area() to plot the data, and need to ensure that there’s one entry per colour per year it was(is) in the production.
> colours <- ddply(crayola, .(colour), transform, + year = issued:retired) |
The plot colours are manually mapped to the original colours using scale_fill_identity().
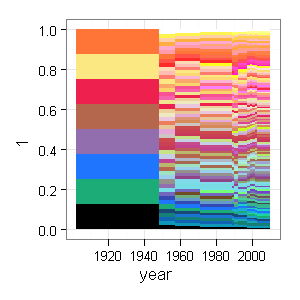
> p <- ggplot(colours, aes(year, 1, fill = colour)) + + geom_bar(width = 1, position = "fill", binwidth = 1) + + theme_bw() + scale_fill_identity() |
And now the geom_area() version:
> p1 <- ggplot(colours, aes(year, 1, fill = colour)) + + geom_area(position = "fill", colour = "white") + + theme_bw() + scale_fill_identity() |

Final Formatting
Next, the x-axis labels suggested by ggplot2 will be manualy overridden. Also I use a little trick to make sure that the labels are properly aligned.
> labels <- c(1903, 1949, 1958, 1972, 1990, 1998,
+     2010)
> breaks <- labels - 1
> x <- scale_x_continuous("", breaks = breaks, labels = labels,
+     expand = c(0, 0))
> y <- scale_y_continuous("", expand = c(0, 0))
> ops <- opts(axis.text.y = theme_blank(), axis.ticks = theme_blank())
|
> p + x + y + ops |
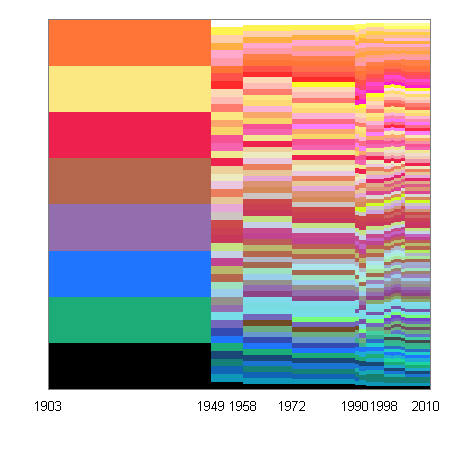
> p1 + x + y + ops |
The order of colours could be changed by sorting the colours by some common feature, unfortunately I did not find an automated way of doing this.
Sorting by Colour
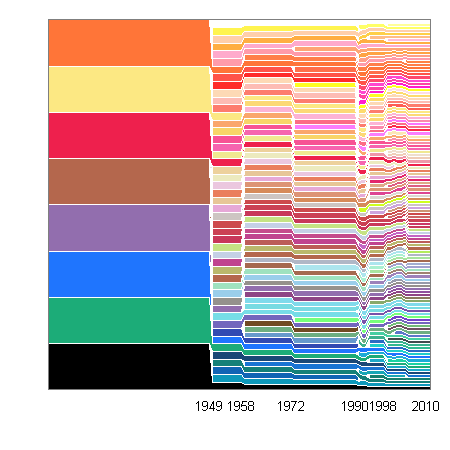
Thanks to Baptiste who showed a way to sort the colours, the final version of the area plot resembles the original even more closely.
> library(colorspace) |
> sort.colours <- function(col) {
+     c.rgb = col2rgb(col)
+     c.RGB = RGB(t(c.rgb) %*% diag(rep(1/255, 3)))
+     c.HSV = as(c.RGB, "HSV")@coords
+     order(c.HSV[, 1], c.HSV[, 2], c.HSV[, 3])
+ }
> colours = ddply(colours, .(year), function(d) d[rev(sort.colours(d$colour)),
+     ])
|
> last_plot() %+% colours |

R-bloggers.com offers daily e-mail updates about R news and tutorials about learning R and many other topics. Click here if you're looking to post or find an R/data-science job.
Want to share your content on R-bloggers? click here if you have a blog, or here if you don't.