Brief Analysis of Abdulmutallab (Christmas Day bomber) Web Posting Data
Want to share your content on R-bloggers? click here if you have a blog, or here if you don't.
 Thanks to Evan Kohlman at the NEFA Foundation for compiling, and Danger Room for publicizing, the data set of all of Farouk Abdulmutallab’s posts to the Islamic Forum on Gawaher.com. Since Evan took the initiative to download and save the raw HTML data, I thought it would be useful to go one step further and parse it into a more useable (analyzable?) format. With a little work in Python and html5lib I was able to convert the HTML into a long comma-delimited file with observation data for post date, time, title, contents, number of views, and number of replies.
With this new data set I did some arm-chair analysis to see what—if any—interesting could be found. Using R along with ggplot2 I generated several visualizations that contain some notable observations. As I sure you are eager to get your hands on the data, I will say before moving on that the CSV file can be downloaded at the ZIA Code Repository along with an R file used to generate the visualizations and analysis after the jump.
UPDATE: The intrepid Michael Bommarito of Computational Legal Studies took it one step further, and downloaded and parsed all of Abdulmutallab’s postings and correspondences on the web forum. More data for the hungry masses, thanks Mike!
First, I am not one for content analysis, but friend and R expert Josh Reich pulled the data and created a nice Wordle of Abdulmutallab’s posts. Some interesting things here, notably the prominence of words like “think,” “help,” and “want.” Rather than look at the posts themselves, I was interested in the activity; and as such I begin with a histogram of his postings over the time perdiod.
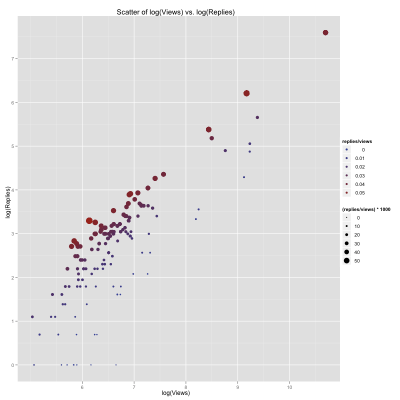
Other than having a very approximate seasonal tendency with two peaks, it is difficult to claim that Abdulmutallab’s posting density followed any strict pattern. Instead, at this binning (every 30 days from the first post, ignore the date label–they are wrong) it appears his activity came in ebbs and flows. Given this bustiness may be useful to also examine the popularity of Abdulmutallab’s posts. Although we have no benchmark for mean post popularity on Gawaher.com, we can examine within the sample. Below is a scatter plot of his post’s views versus replies, with points sized and colored by the ratio of replies to views.
This data is quite skewed, so logs were taken, and from this we can see the relationship is rather linear. There are; however, several notable posts that receive nearly one reply for every two views (large red points). For the final analysis I combine both time and activity to see if there were any periods where Abdulmutallab received notably high attention from forum users. The plot below shows his post’s view and reply counts in chronological order.
Two interesting observation from this visualzation. First, while the previous plot indicates that several posts receive a high ratio of replies to views, this plot shows that these high ratio posts are not the most popular. In fact, the most popular posts (by view count) have relatively few replies, and all happen within a short time span. This latter observations is most interesting, as clearly Abdulmutallab was writing on something very interesting to the Gawaher.com audience during this span. The next step would be to go back into the data, examine that time period and analyze the posts’ content.
Another idea would be to create a model to examine if lagged number of replies predicted length or content of a post. There may also be something interesting to say about the content of a post’s title and the how that attracts users. Unfortunately, without the content of those replies and only the count it is hard to determine what the relationship is.
What are your ideas?
Photo: Danger Room
R-bloggers.com offers daily e-mail updates about R news and tutorials about learning R and many other topics. Click here if you're looking to post or find an R/data-science job.
Want to share your content on R-bloggers? click here if you have a blog, or here if you don't.


