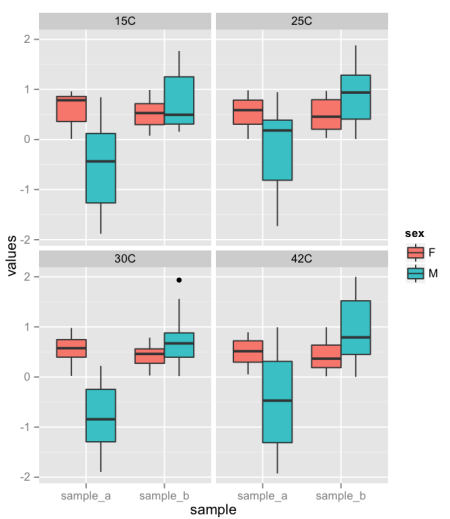
ggplot2 multiple boxplots with metadata
[This article was first published on mintgene » R, and kindly contributed to R-bloggers]. (You can report issue about the content on this page here)
Want to share your content on R-bloggers? click here if you have a blog, or here if you don't.
Want to share your content on R-bloggers? click here if you have a blog, or here if you don't.
Recently I was asked for an advice of how to plot values with an additional attached condition separating the boxplots. This turns out to be ugly in base graphics, but amazingly simple in ggplot2.
library(ggplot2)

# create fake dataset with additional attributes - sex, sample, and temperature
x <- data.frame(
 values = c(runif(100, min = -2), runif(100), runif(100, max = 2), runif(100)),
 sex = rep(c('M', 'F'), each = 100),
 sample = rep(c('sample_a', 'sample_b'), each = 200),
 temperature = sample(c('15C', '25C', '30C', '42C'), 400, replace = TRUE)
)

# compare different sample populations across various temperatures
ggplot(x, aes(x = sample, y = values, fill = sex)) +
geom_boxplot() +
facet_wrap(~ temperature)
To leave a comment for the author, please follow the link and comment on their blog: mintgene » R.
R-bloggers.com offers daily e-mail updates about R news and tutorials about learning R and many other topics. Click here if you're looking to post or find an R/data-science job.
Want to share your content on R-bloggers? click here if you have a blog, or here if you don't.

